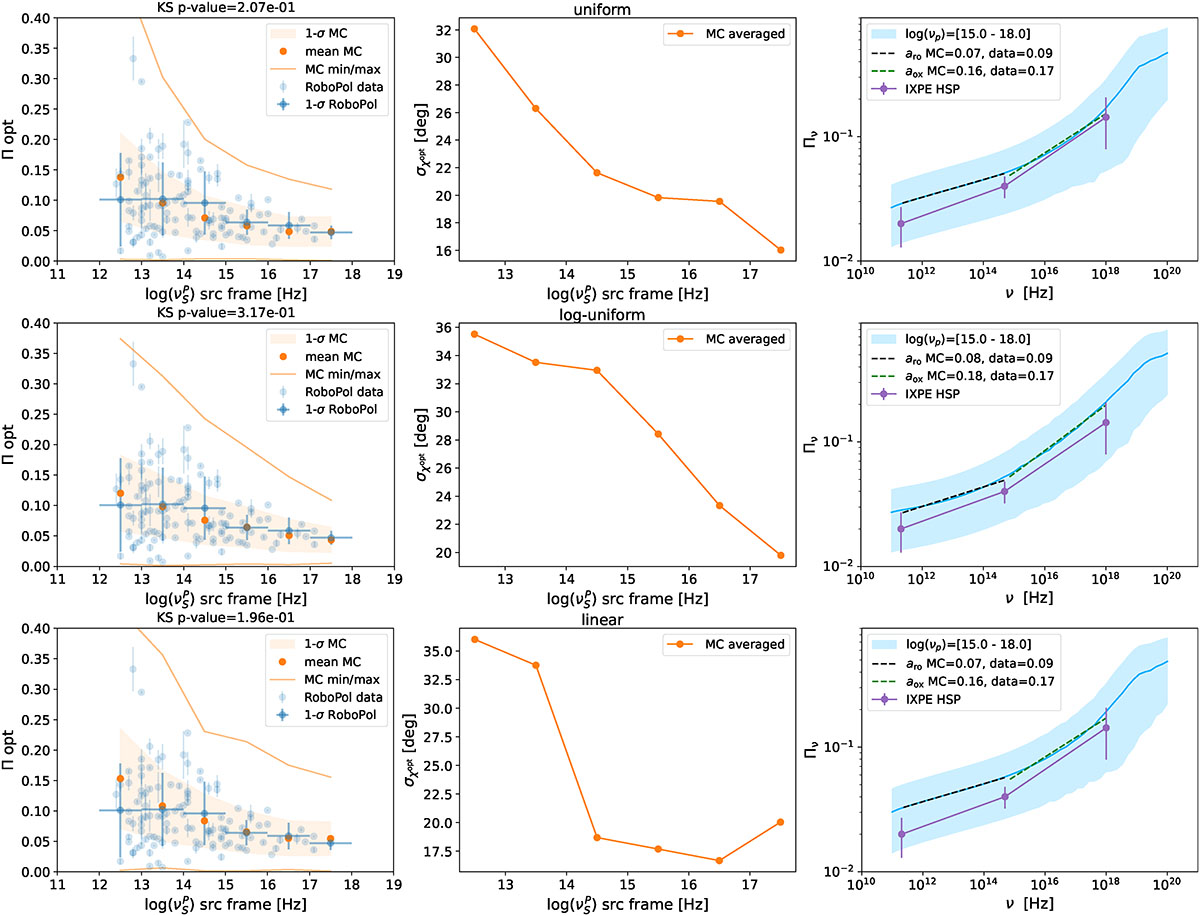
Fig. 9.
Download original image
Best runs for fγcut = uniform (top panels), fγcut = log-uniform (middle panels), and fγcut = linear (bottom panels). The left panels show the Πopt-versus-νpS limiting envelopes for both the MC simulations and the observed RoboPol data, the center panels show the trends of the MC-averaged dispersion of the MC optical EVPA angle vs νpS, and in the right panels, the IXPE HPS observed trends compared to the MC results extracted from the same runs used for the RoboPol panels.
Current usage metrics show cumulative count of Article Views (full-text article views including HTML views, PDF and ePub downloads, according to the available data) and Abstracts Views on Vision4Press platform.
Data correspond to usage on the plateform after 2015. The current usage metrics is available 48-96 hours after online publication and is updated daily on week days.
Initial download of the metrics may take a while.