Fig. 2.
Download original image
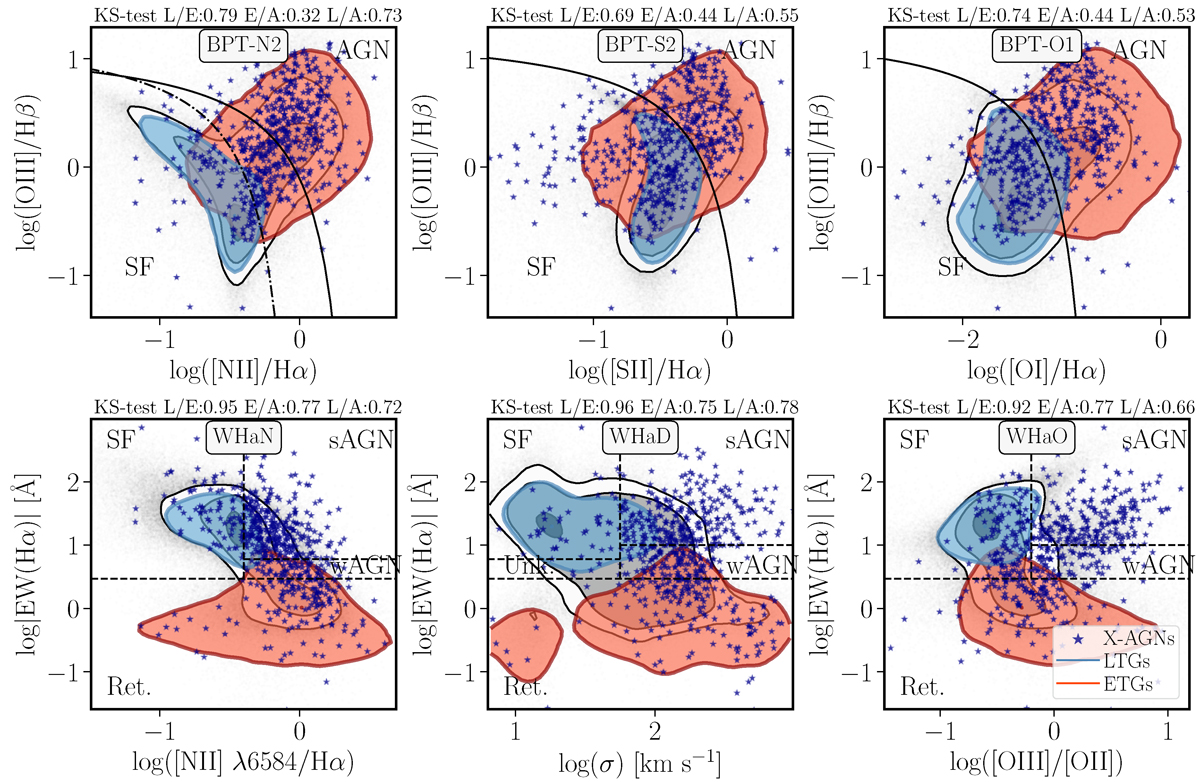
Distribution of the subsamples of galaxies across different diagnostic diagram. Top panels: Classical BPT diagrams (Baldwin et al. 1981), showing the distribution of O III/Hβ line ratio as a function of N II/Hα ratio (left panel), S II/Hα (middle panel), and O I/Hα (right panel). Solid and dot-dashed lines correspond to the demarcation lines proposed by K03 and K01 to distinguish between the different ionizing sources. Bottom panels: Diagrams comparing the distribution of Equivalent-width of Hα (WHα) as a function of (i) the N II/Hα ratio (left panel) WHaN diagram (Cid Fernandes et al. 2010; ii) the Hα velocity dispersion (σHα, middle panel), WHaD diagram (Sánchez et al. 2024); and (iii) the O III/O II line ratio (right panel), proposed here as the WHaO diagram. In each panel, the black dots correspond to the full NMJ sample and each successive grey contour represents the area encircling the 90%, 65%, and a 15% of these points. The blue (red) contour represent the area that encircles 90% of the values corresponding to the LT (ET) subsamples of galaxies, as defined in the text. Finally, the location of the X-ray-selected AGNs are shown as dark-blue stars. The D parameter derived for a set of 2D KS-tests comparing the distributions of the different subsamples are included on top of each panel, using the nomenclature L/E when comparing LTGs versus ETGs, E/A for ETGs versus X-AGNs, and L/A for LTGs versus X-AGNs.
Current usage metrics show cumulative count of Article Views (full-text article views including HTML views, PDF and ePub downloads, according to the available data) and Abstracts Views on Vision4Press platform.
Data correspond to usage on the plateform after 2015. The current usage metrics is available 48-96 hours after online publication and is updated daily on week days.
Initial download of the metrics may take a while.