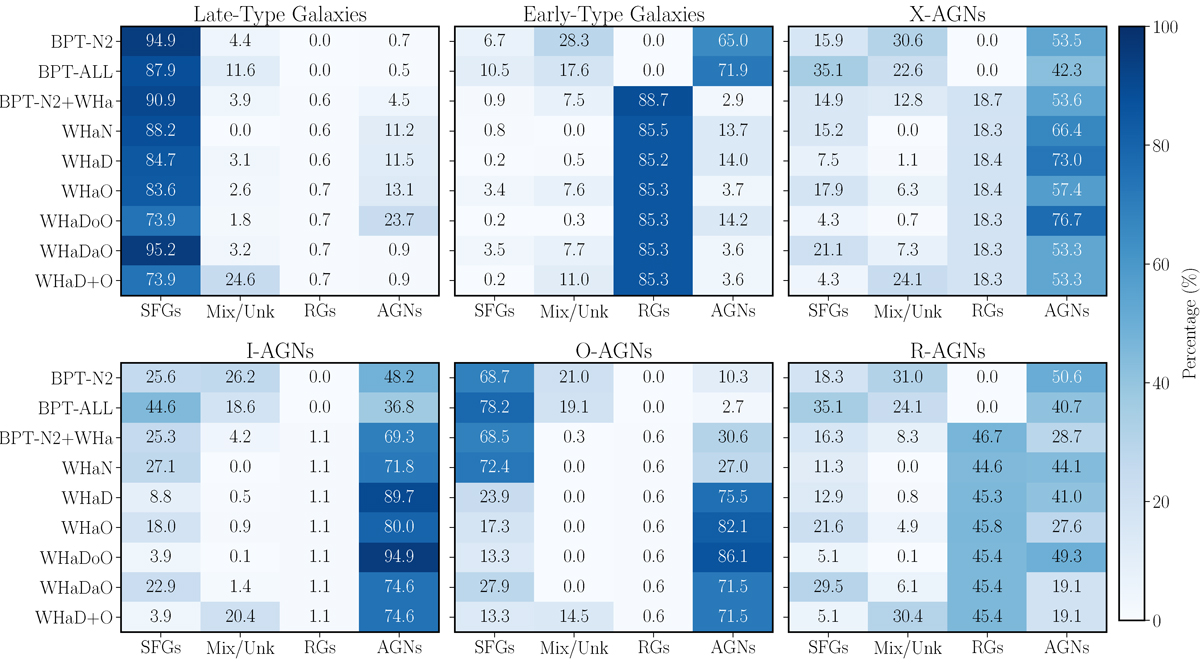
Fig. 3.
Download original image
Differences found in the classification of the dominant ionization when using different diagnostics. Each panel comprises a heat-map showing the fraction of objects (color scale and values within each cell) assigned to each type of ionization by a different diagnostic diagram for a different subsample of galaxies (from the top left to bottom right): LTGs, ETGs, X-ray-selected AGNs (X-AGNs), IR-selected AGNs (I-AGNs), UV-optically selected AGNs (O-AGNs), and radio-selected AGNs (R-AGNs). Each heat-map column corresponds to the different ionizing types considered in this work, namely: (i) ionization associated with recent SFGs; (ii) mixed or unknown ionization (Mix/Unk); (iii) ionization usually found in non-star-forming and retired galaxies (RGs), due to hot evolved stars (Binette et al. 1994; Flores-Fajardo et al. 2011), and/or low-velocity shocks (Dopita et al. 1996); and (iv) ionization associated with AGNs and or shocks associated with galactic scale winds (e.g., López-Cobá et al. 2020). On the other hand, each row corresponds to a different diagnostic scheme, including the use of: (i) the classical diagram by Baldwin et al. (1981) that uses O III/Hβ and N II/Hα line ratios (BPT-N2); (ii) the three diagrams by Baldwin et al. (1981) that use the O III/Hβ vs. N II/Hα S II/Hα and O I/Ha line ratios (BPT-all); (iii) the BPT-N2 diagram including a cut in the equivalent width of Hα (BPT-N2+WHa), as described in Sánchez (2020); (iv) the WHaN diagram that uses the N II/Hα and the equivalent width of Hα (WHaN); (v) the diagram introduced by Sánchez et al. (2024) that uses N II/Hα and the velocity dispersion of Hα (WHaD); (vi) the new proposed diagram that uses O III/O II and the equivalent width of Hα (WHaO). Finally, we have three different combinations that use the WHaD and WHaO diagrams: (vii) WHaDoO, (viii) WHaDoO, and (ix) WHaD+O, as described in the text.
Current usage metrics show cumulative count of Article Views (full-text article views including HTML views, PDF and ePub downloads, according to the available data) and Abstracts Views on Vision4Press platform.
Data correspond to usage on the plateform after 2015. The current usage metrics is available 48-96 hours after online publication and is updated daily on week days.
Initial download of the metrics may take a while.