Fig. 5.
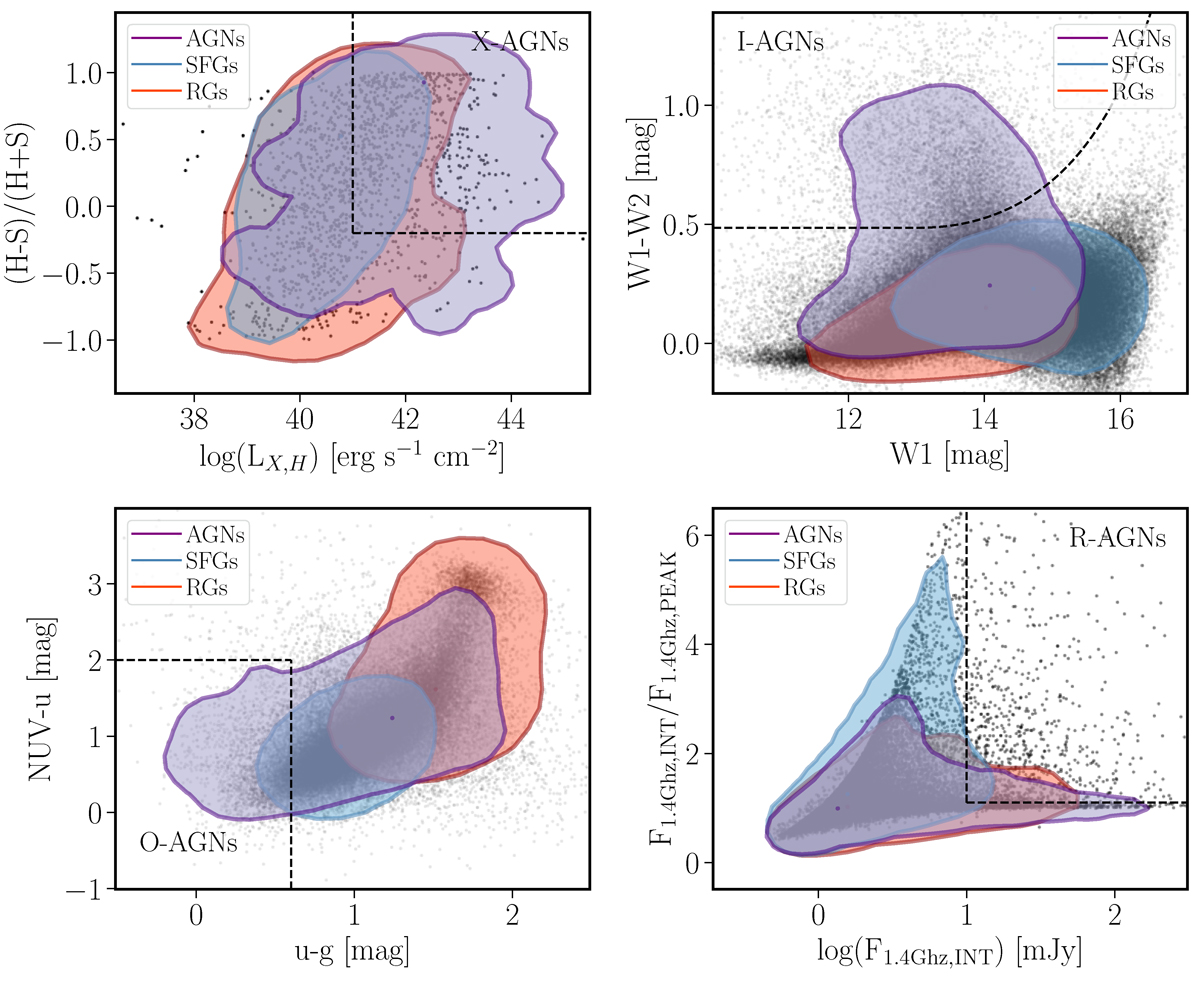
Download original image
Distribution of the full sample of galaxies in the four set of properties used to select the candidates to AGNs employed in this study: Top-left panel: X-ray properties, showing the X-ray hardness ratio as a function of the X-ray luminosity. Top-right panel: IR properties, showing the WISE W1 − W2 color as a function of the WISE W2 magnitude. Bottom-left panel: UV-optical properties, showing NUV − u color as a function of u − g one. Bottom-right panel: Radio properties, showing the ratio between the integrated and peak intensity at 1.4 GHz as a function of the integrated intensity. Each panel adopts the same symbols and color scheme: (i) solid circles correspond to the full sample of galaxies with measured properties, comprising 1390 objects for the X-ray panel, 541 478 for the IR one, 547 928 for the UV-optical one, and 15 839 for the radio one; (ii) contours represent the area that encircles 95% of the objects with ionization classified as star-forming (SFGs, blue), retired galaxies (RGs, red), and AGNs (purple) using out final classification scheme described in Sect. 3; (iii) dashed-lines show the demarcation lines described in Sect. 3 to select the AGN candidates using the represented properties.
Current usage metrics show cumulative count of Article Views (full-text article views including HTML views, PDF and ePub downloads, according to the available data) and Abstracts Views on Vision4Press platform.
Data correspond to usage on the plateform after 2015. The current usage metrics is available 48-96 hours after online publication and is updated daily on week days.
Initial download of the metrics may take a while.