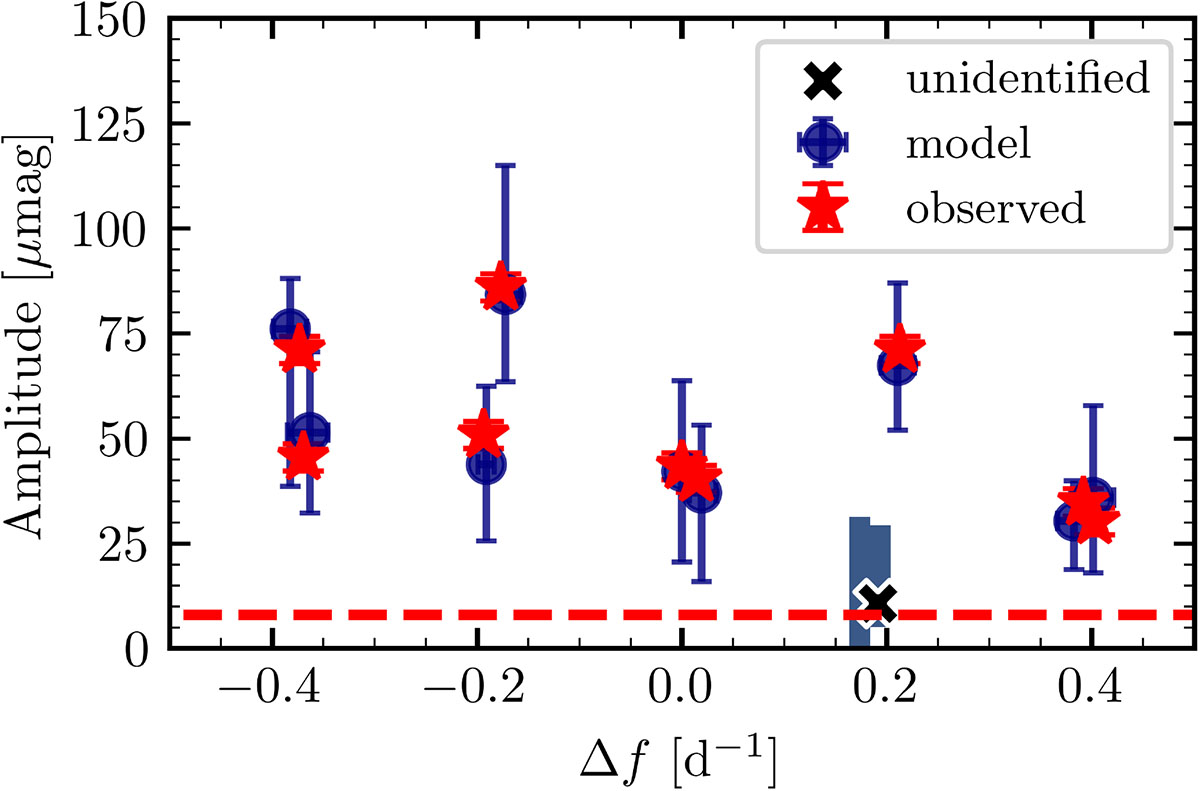
Fig. 1.
Download original image
Predictions of the best-fitting magneto-gravito pulsation model from Set 5 and its uncertainties (dark blue). The black cross indicates a predicted frequency not detected in the data. The blue shaded area shows all possible locations of unidentified frequencies. The dashed red line shows the local average noise level in the data. The 95% confidence intervals for the predicted frequency differences are smaller than the size of the markers.
Current usage metrics show cumulative count of Article Views (full-text article views including HTML views, PDF and ePub downloads, according to the available data) and Abstracts Views on Vision4Press platform.
Data correspond to usage on the plateform after 2015. The current usage metrics is available 48-96 hours after online publication and is updated daily on week days.
Initial download of the metrics may take a while.