Fig. 1.
Download original image
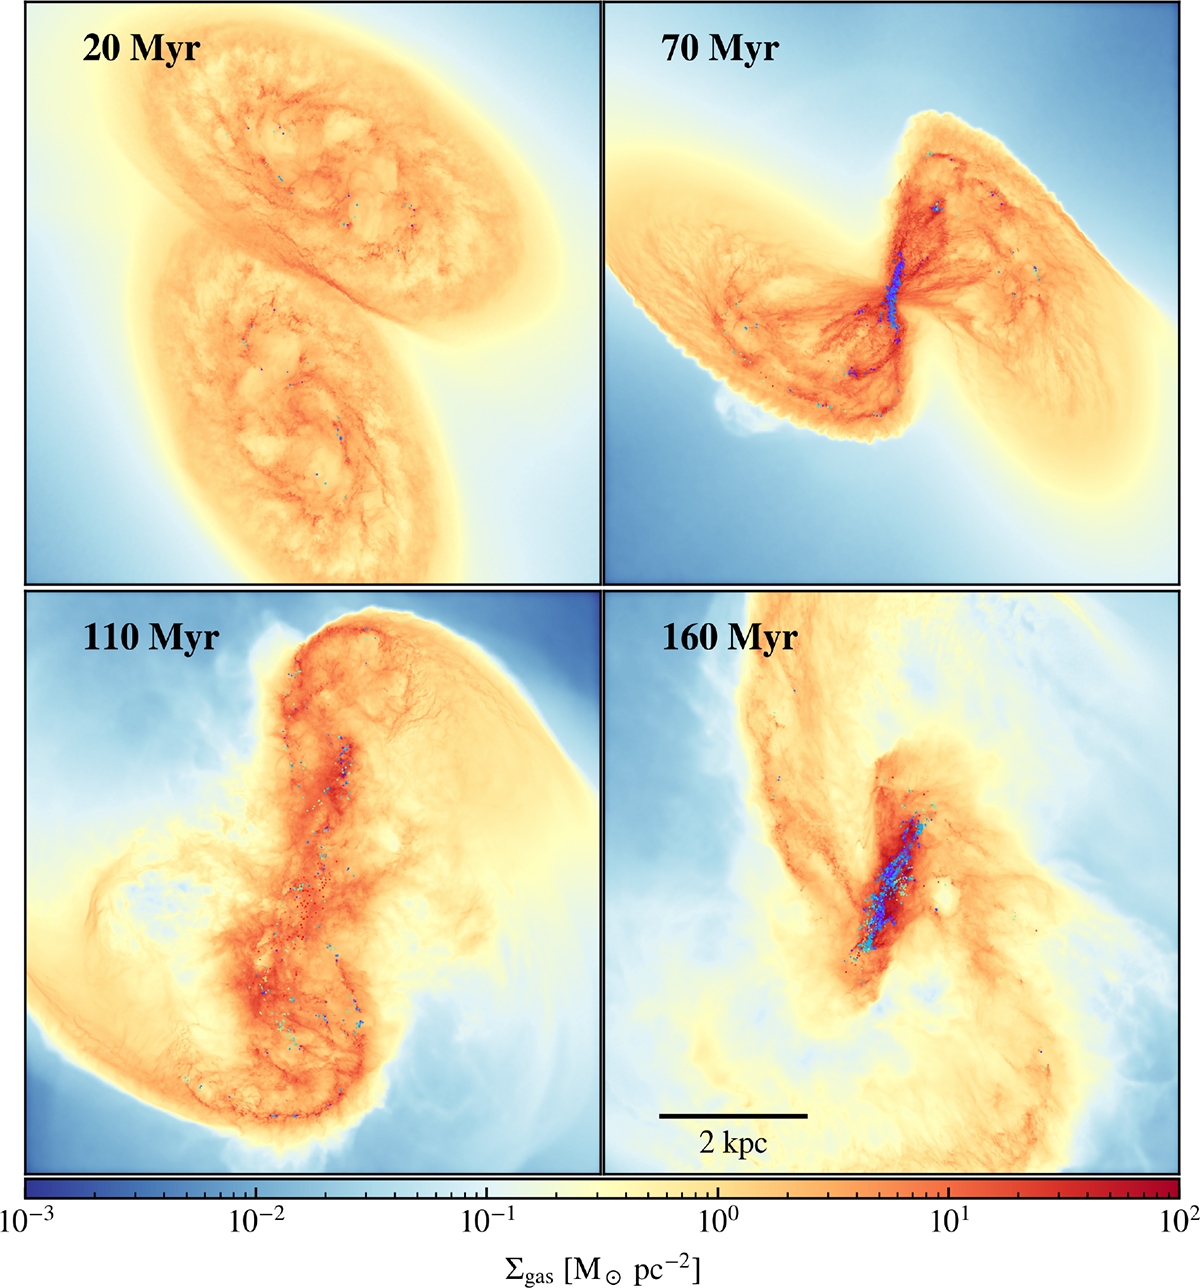
Gas surface density maps in different merger stages. The four panels show snapshots of the approaching stage (20 Myr, upper left), the first passage when the first SF peak appears (70 Myr, upper right), the first apocenter when the SFR exhibits a plateau (110 Myr, bottom left), and the second encounter when the second SF peak occurs (160 Myr, bottom right). The overset points represent young (< 40 Myr) and massive (> 8 M⊙) stars with ages color-coded from violet (youngest) to red (oldest). A movie of the simulation is available at https://www.bilibili.com/video/BV18vKRzzEnj.
Current usage metrics show cumulative count of Article Views (full-text article views including HTML views, PDF and ePub downloads, according to the available data) and Abstracts Views on Vision4Press platform.
Data correspond to usage on the plateform after 2015. The current usage metrics is available 48-96 hours after online publication and is updated daily on week days.
Initial download of the metrics may take a while.