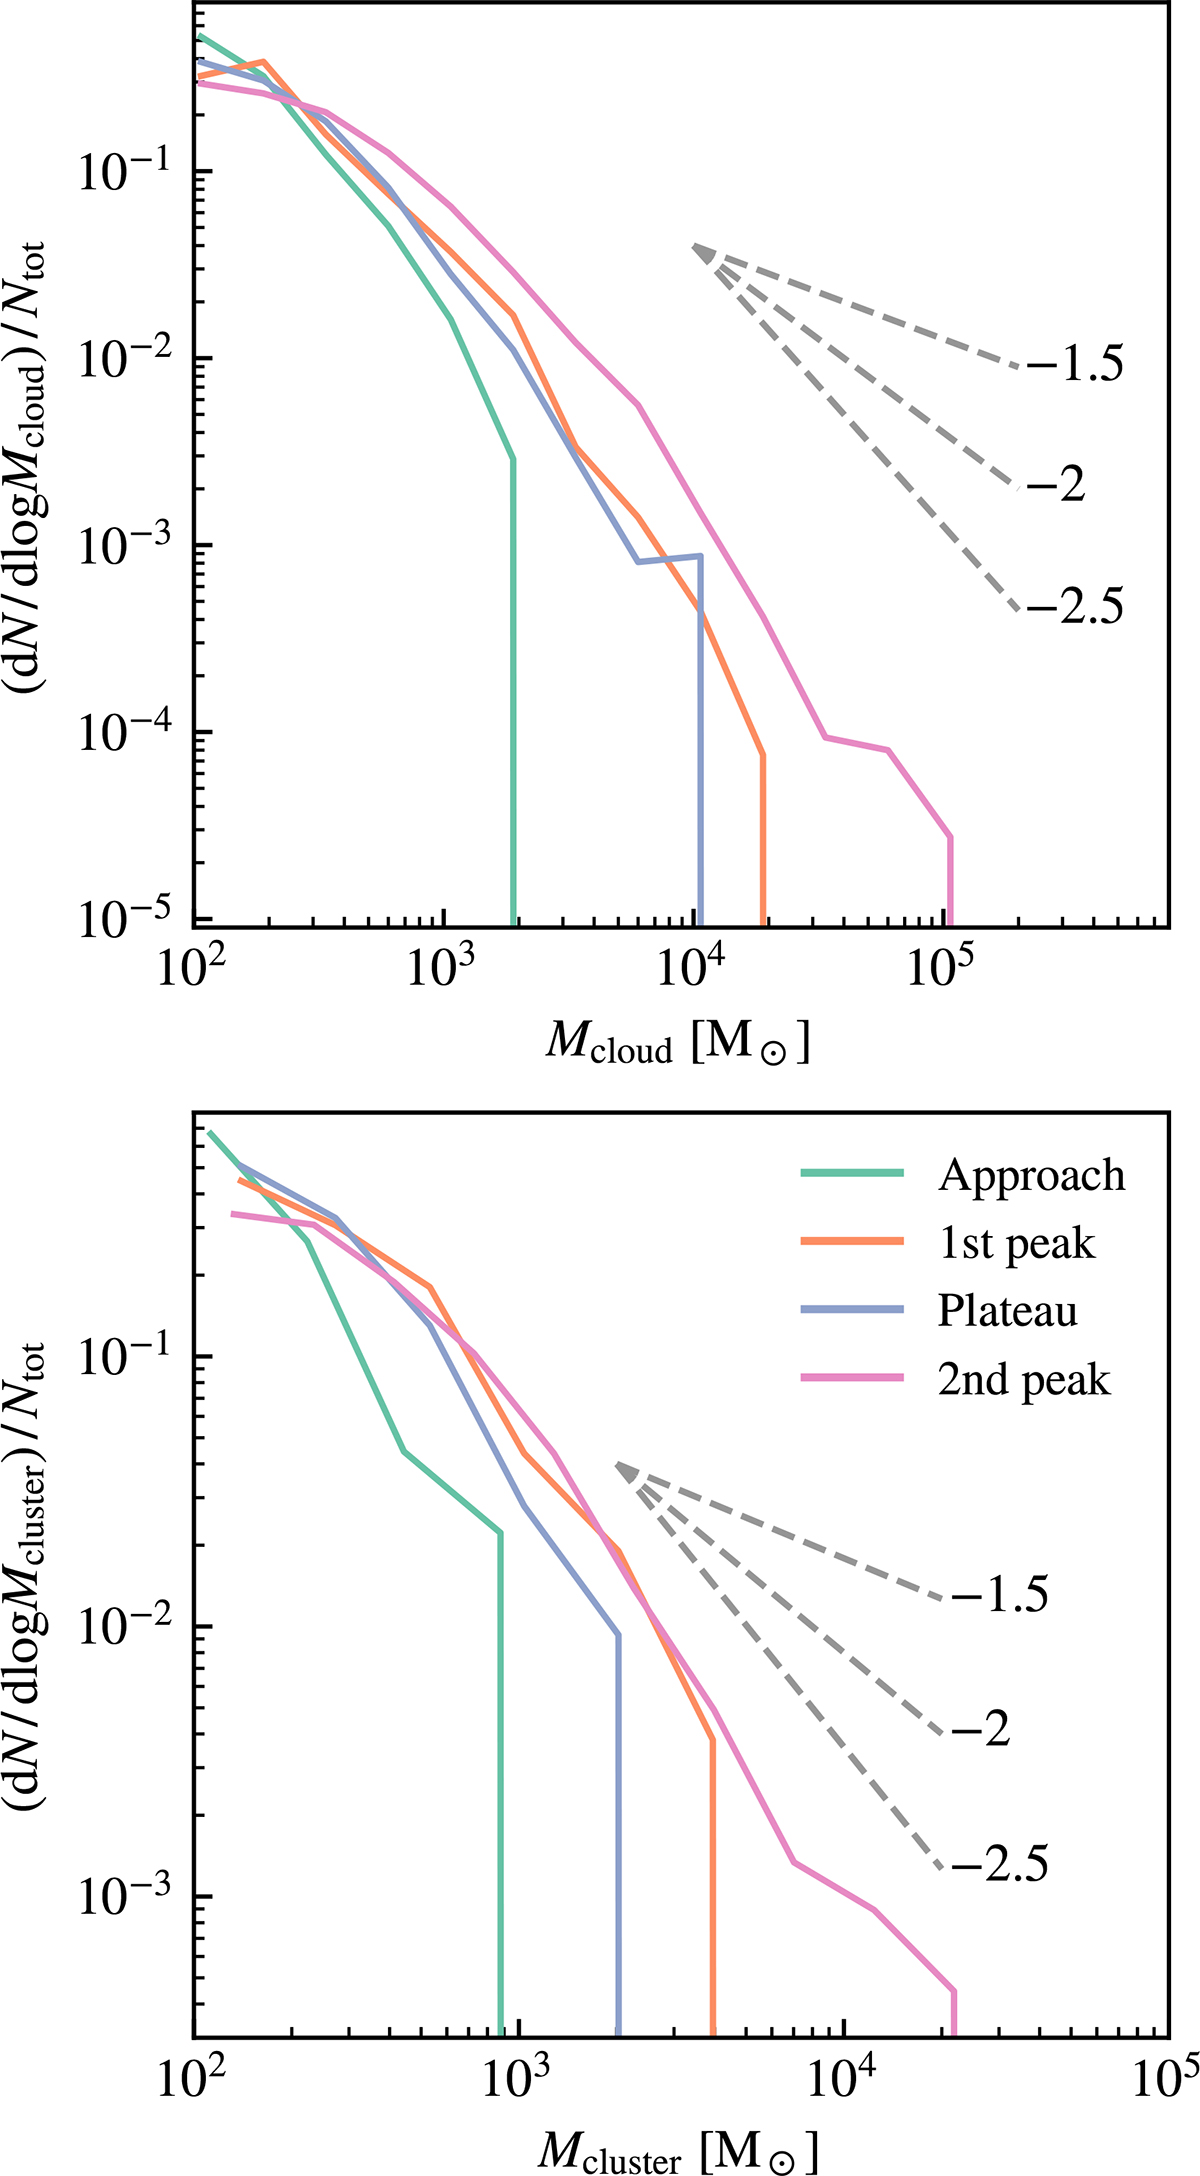
Fig. 11.
Download original image
Cloud mass functions (top panel) and young cluster (< 5 Myr) initial mass functions (CIMFs, bottom panel) of the merger system at different stages. The dashed gray line denotes the power-law relation with a slope of −1.5, −2, and −2.5, respectively. A starburst induced by the merger leads to the formation of massive clusters, especially during the second SFR peak. The maximum cloud masses are (1.8, 23, 11, 90)×103 M⊙ for the Approach, 1st peak, Plateau, and 2nd peak stages, respectively. The maximum cluster masses are (0.93, 3.4, 1.8, 26)×103 M⊙ for these four stages.
Current usage metrics show cumulative count of Article Views (full-text article views including HTML views, PDF and ePub downloads, according to the available data) and Abstracts Views on Vision4Press platform.
Data correspond to usage on the plateform after 2015. The current usage metrics is available 48-96 hours after online publication and is updated daily on week days.
Initial download of the metrics may take a while.