Fig. 12.
Download original image
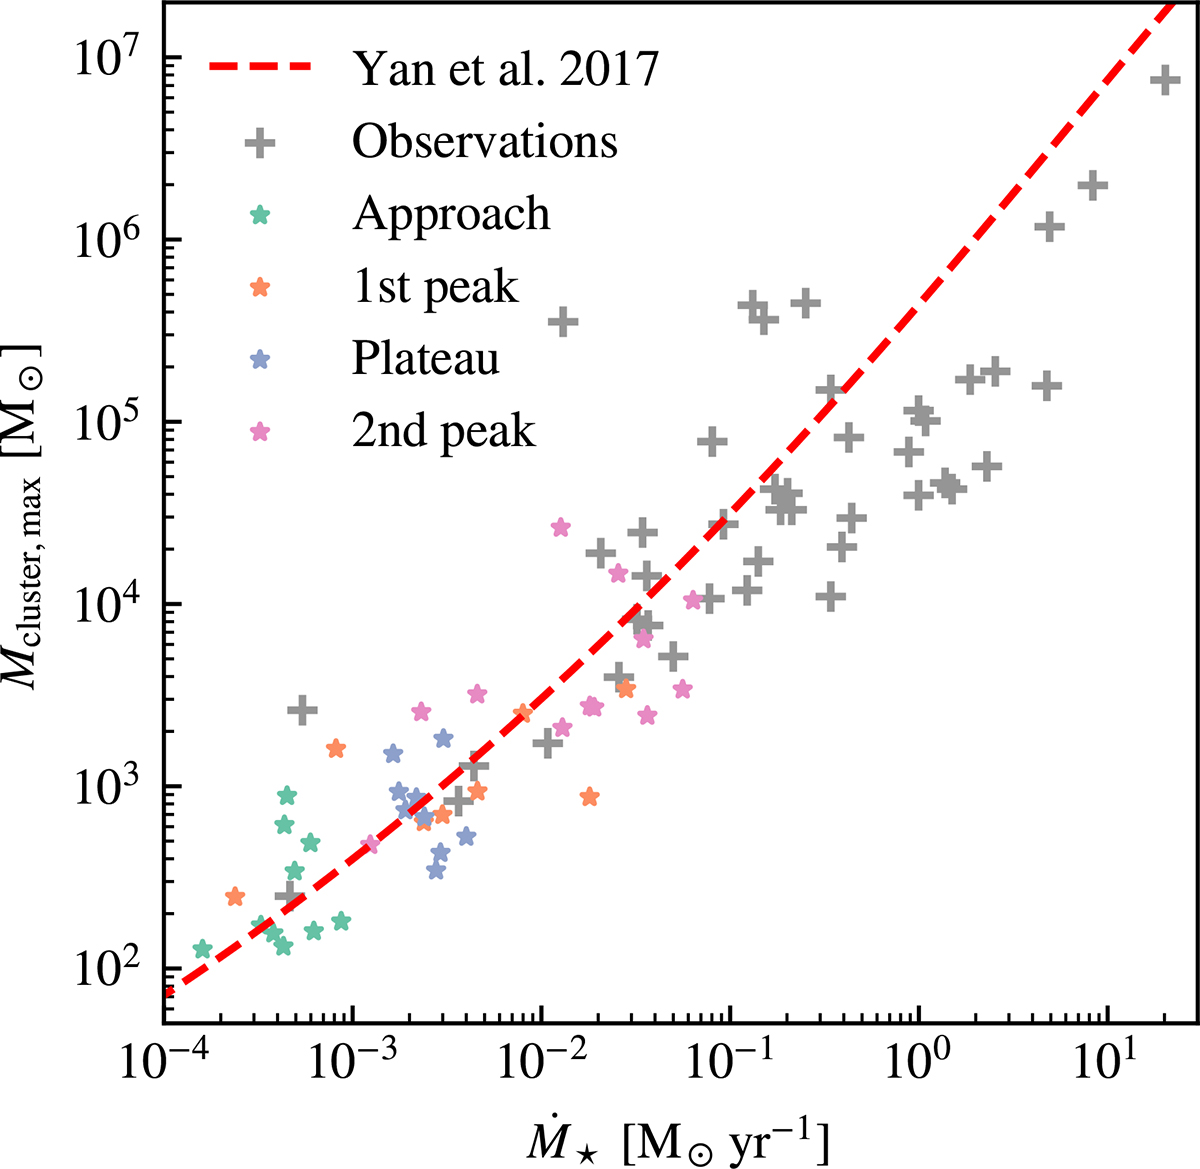
Most massive young cluster mass vs. galaxy-wide SFR (Mcluster, max–Ṁ★) relation. The simulation data are color-coded by stage of the merger. The dashed red line represents the theoretical relation derived following Yan et al. (2017). The gray crosses represent observational data from Weidner & Kroupa (2004) and Schulz et al. (2015), which have a typical uncertainty of 0.3 dex.
Current usage metrics show cumulative count of Article Views (full-text article views including HTML views, PDF and ePub downloads, according to the available data) and Abstracts Views on Vision4Press platform.
Data correspond to usage on the plateform after 2015. The current usage metrics is available 48-96 hours after online publication and is updated daily on week days.
Initial download of the metrics may take a while.