Fig. 13.
Download original image
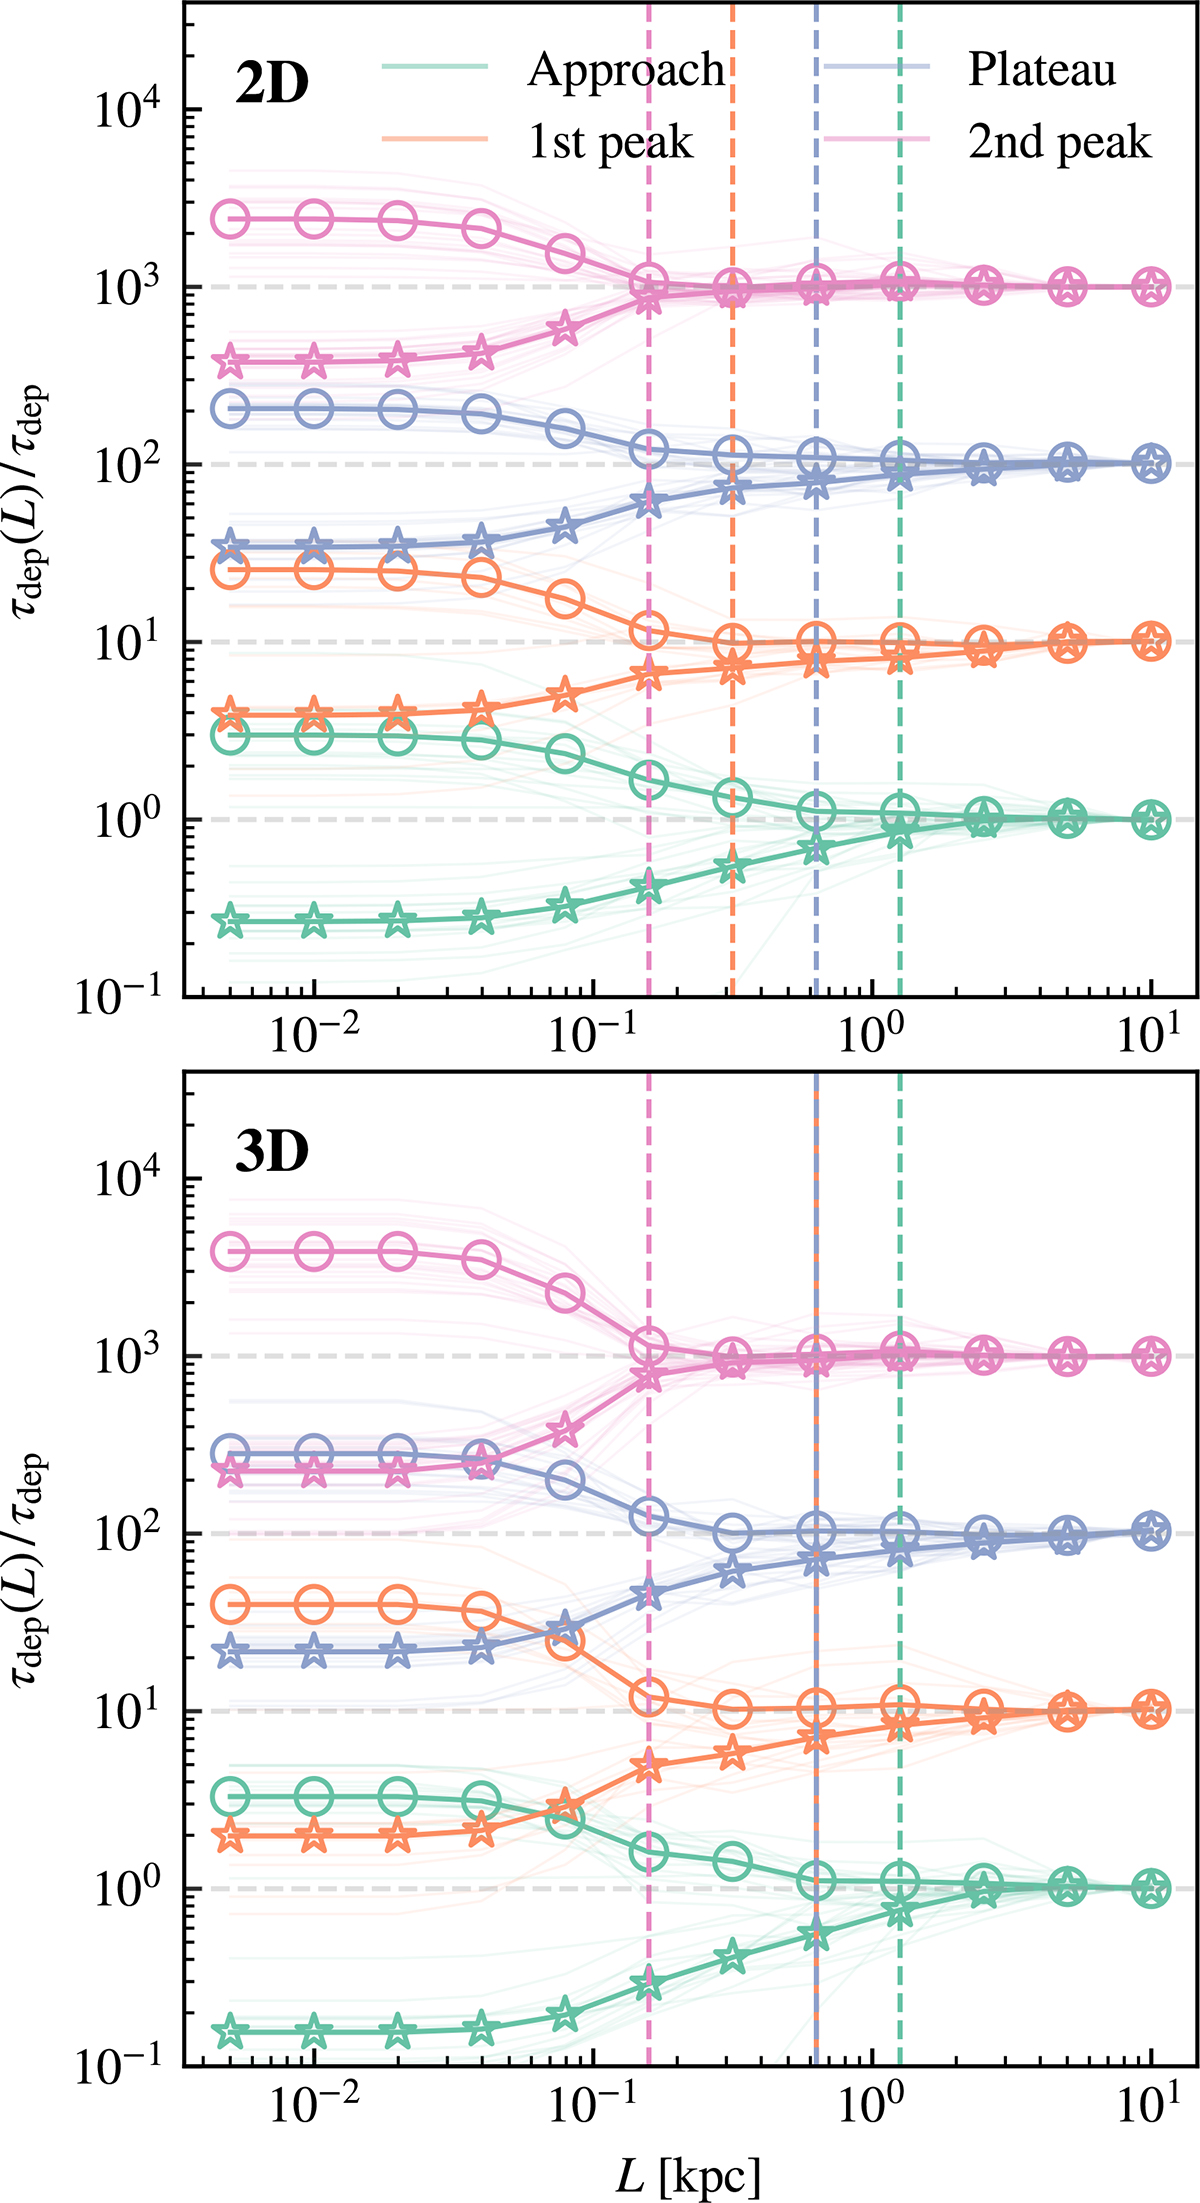
2D (top panel) and 3D (bottom panel) “tuning fork” diagrams from our simulation at different phases. These diagrams reflect the deviation of the H2 depletion time centered on H2 (τH2, gas, upper branch) or recent SFR peaks (τH2, SFR, lower branch) from the galaxy-averaged value as a function of the spatial scale L. The curves of the 1st peak, Plateau, and 2nd peak are multiplied by constants of 10, 100, and 1000, respectively, to avoid overlapping. The vertical lines indicate the scale when τH2, gas exceeds τH2, SFR by 50%.
Current usage metrics show cumulative count of Article Views (full-text article views including HTML views, PDF and ePub downloads, according to the available data) and Abstracts Views on Vision4Press platform.
Data correspond to usage on the plateform after 2015. The current usage metrics is available 48-96 hours after online publication and is updated daily on week days.
Initial download of the metrics may take a while.