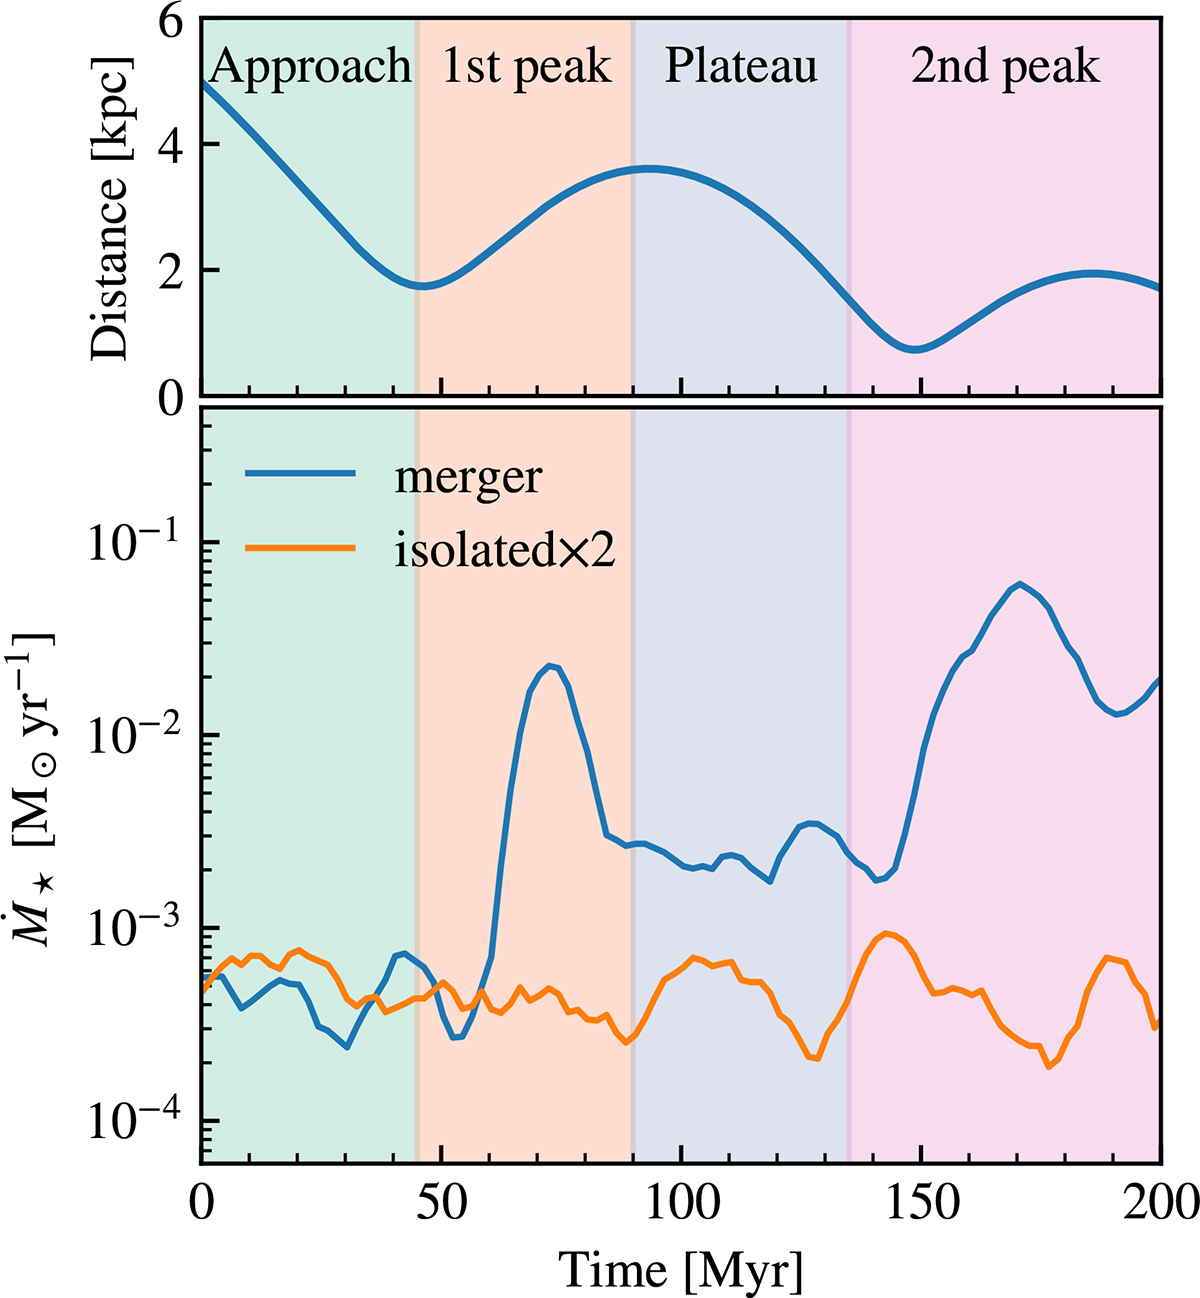
Fig. 2.
Download original image
Evolution of the distance between two galaxies (upper panel) and the SF history of the merger system (bottom panel). The distance is measured between the centers of mass of the background stars in the galaxies. Bottom panel: SFR averaged over a timescale of 5 Myr. The blue curve represents the total SFR of the two dwarfs in the merger, while the orange curve represents twice the SFR of an isolated dwarf galaxy. The four stages of the merger–“Approach”, “1st peak”, “Plateau”, and “2nd peak” –are marked with shaded regions in various colors.
Current usage metrics show cumulative count of Article Views (full-text article views including HTML views, PDF and ePub downloads, according to the available data) and Abstracts Views on Vision4Press platform.
Data correspond to usage on the plateform after 2015. The current usage metrics is available 48-96 hours after online publication and is updated daily on week days.
Initial download of the metrics may take a while.