Fig. 3.
Download original image
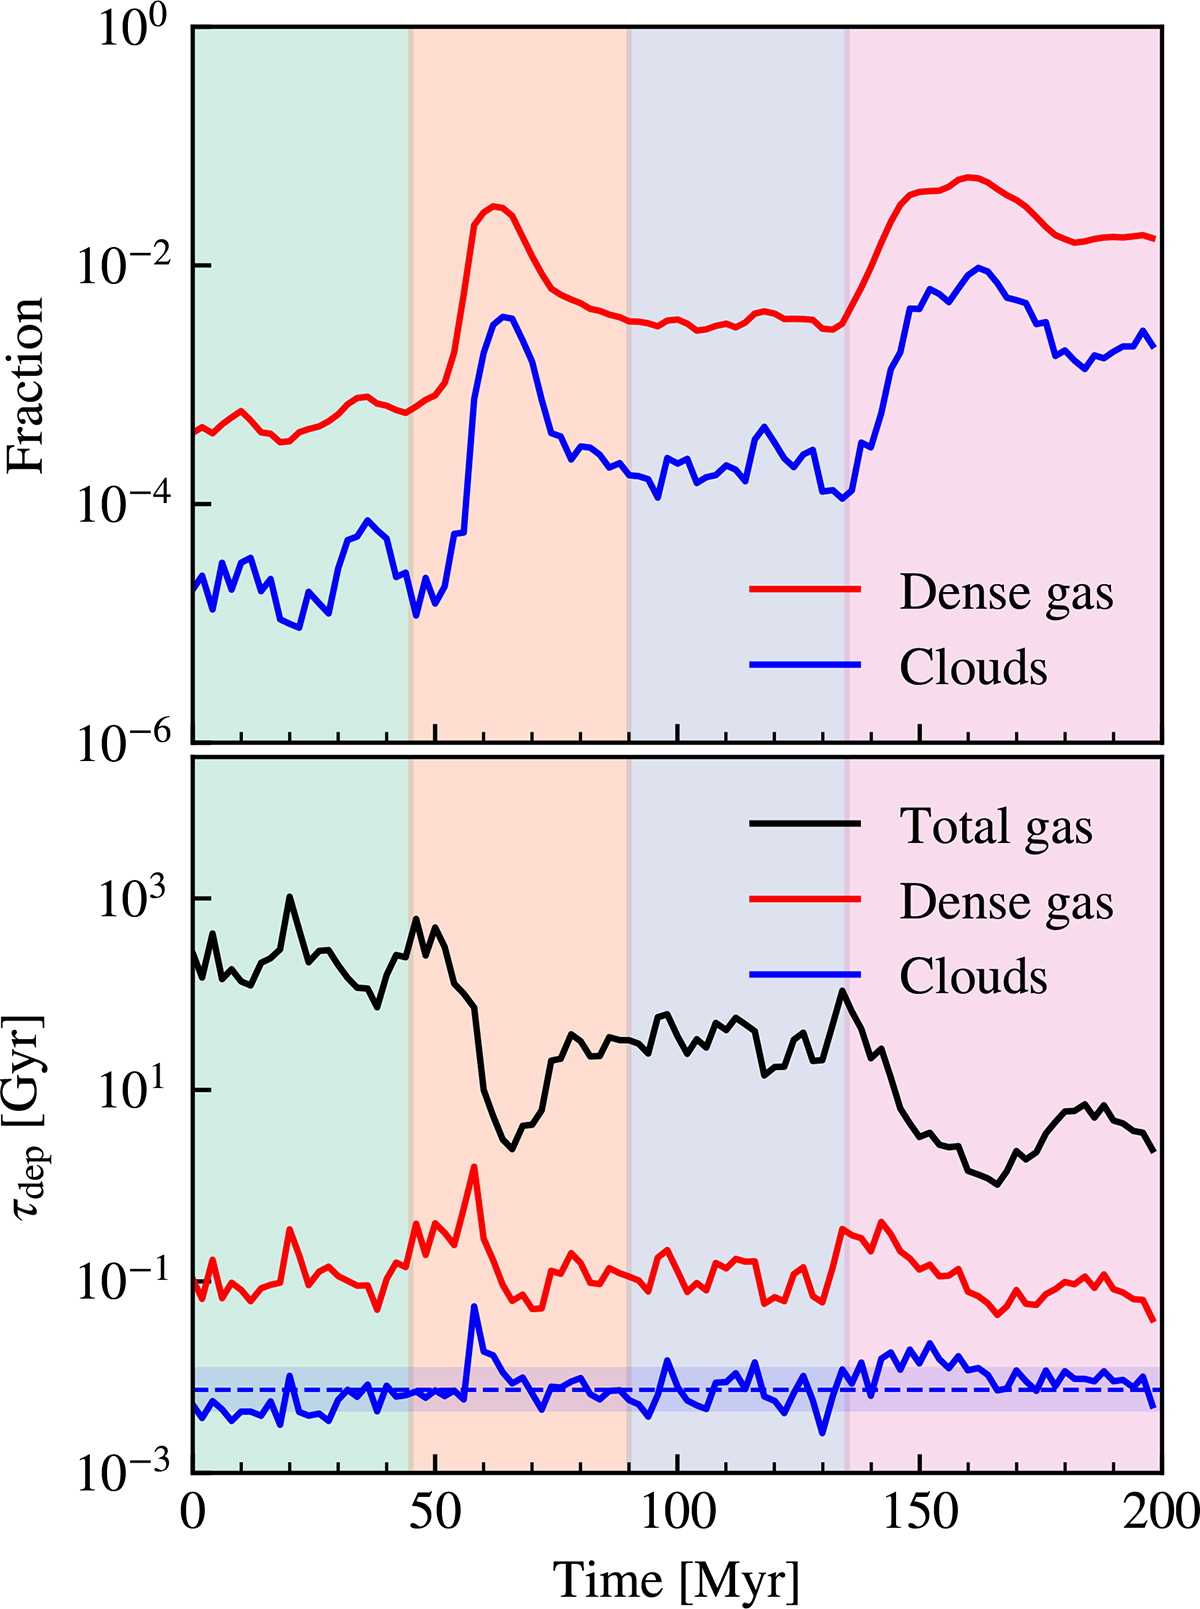
Evolution of galaxy-wide ISM properties and depletion time. Upper panel: Evolution of the fraction of nH > 100 cm−3 dense gas (red curve) and gas in identified clouds (dense gas clumps with virial parameter α < 10, blue curve). Bottom panel: Galaxy-wide depletion times calculated by the total gas mass (black curve), dense gas mass (red curve), and total cloud mass (blue curve). The depletion time of the gas in the clouds fluctuates around its median value of 7.4 Myr (dashed blue line), with a 16–84 percentile range of 4.7–12 Myr.
Current usage metrics show cumulative count of Article Views (full-text article views including HTML views, PDF and ePub downloads, according to the available data) and Abstracts Views on Vision4Press platform.
Data correspond to usage on the plateform after 2015. The current usage metrics is available 48-96 hours after online publication and is updated daily on week days.
Initial download of the metrics may take a while.