Fig. 4.
Download original image
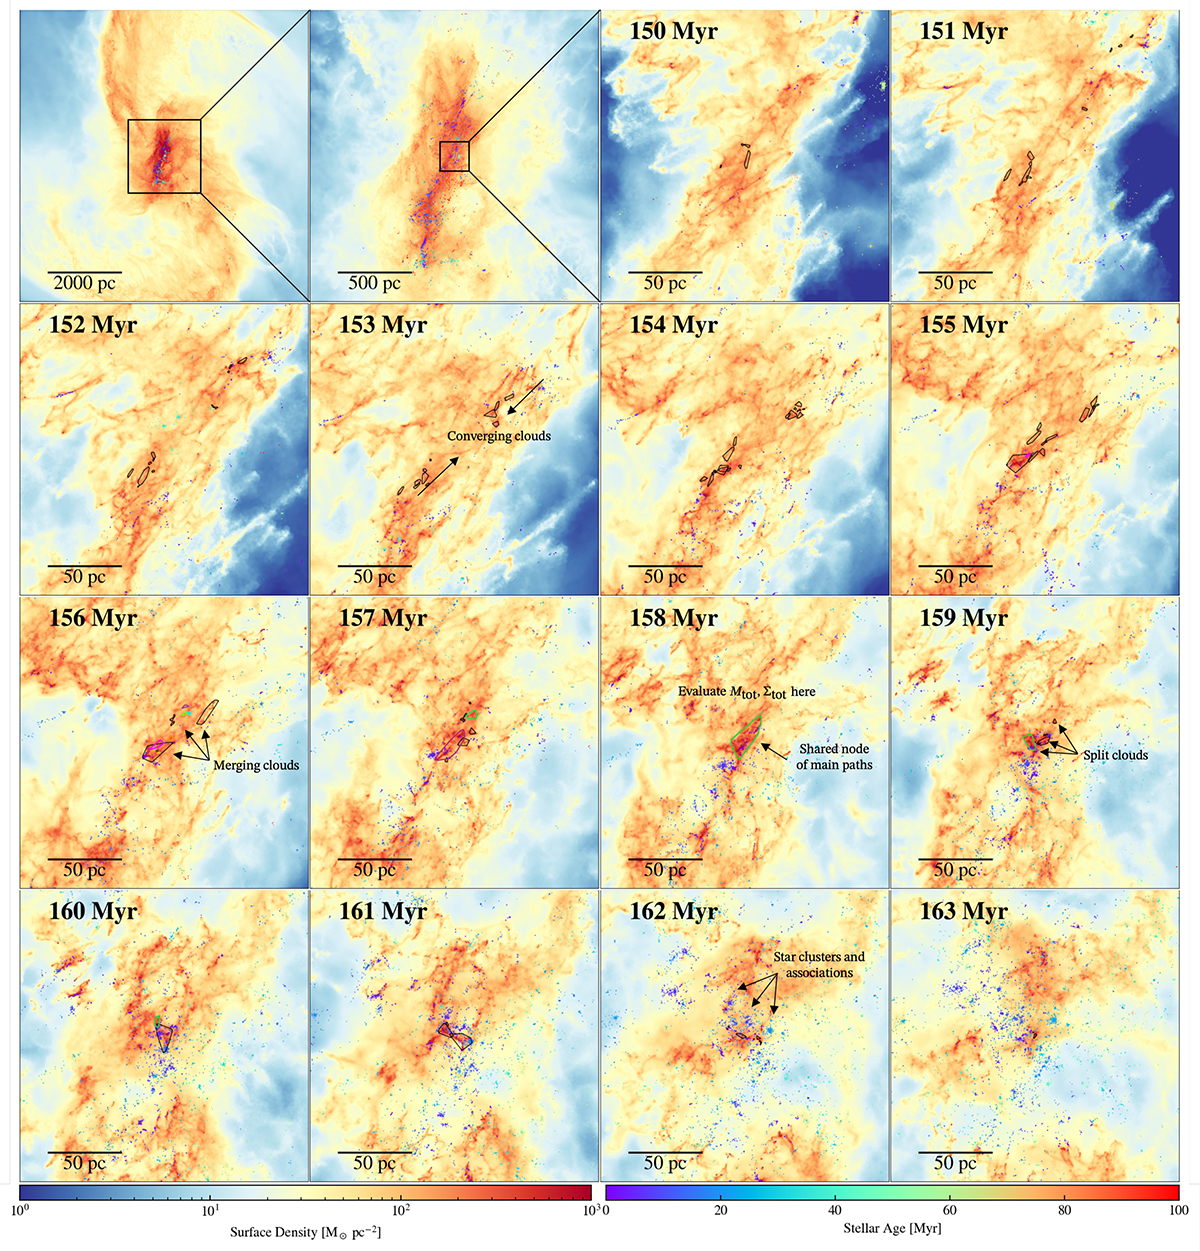
Evolution of clouds in a sequence spanning 14 Myr. The first two panels show the location of the zoom-in region in the merger system. The third to the last panels show the column density distribution inside a (200 pc)3 box. In these panels, the color maps refer to the gas surface density distribution of the zoom-in regions, and the dots represent the stars color-coded according to their age. The polygons in the zoom-in panels depict the 2D convex hulls of the clouds identified from a specific evolution graph. The evolution paths in this graph merge at 158 Myr and share a node (green polygon), where we evaluate the total baryon mass Mtot and surface density Σtot for the SFE calculation (see Section 4.3). The clouds form in the upper-right and lower-left regions at the beginning (see the panel of 153 Myr for an example) and accumulate at the center (155 Myr). Star clusters appear at 156 Myr, but the cloud continues to accumulate mass from the upper-right, forming a large single cloud at 159 Myr. The cloud continues to form stars while collapsing. Finally, the stellar feedback rapidly disperses the clouds, leaving bubbles within 4 Myr. The colorful polygons appearing between 155 Myr to 160 Myr indicate the main paths sharing the same maximum baryon mass node in this evolution graph.
Current usage metrics show cumulative count of Article Views (full-text article views including HTML views, PDF and ePub downloads, according to the available data) and Abstracts Views on Vision4Press platform.
Data correspond to usage on the plateform after 2015. The current usage metrics is available 48-96 hours after online publication and is updated daily on week days.
Initial download of the metrics may take a while.