Fig. 5.
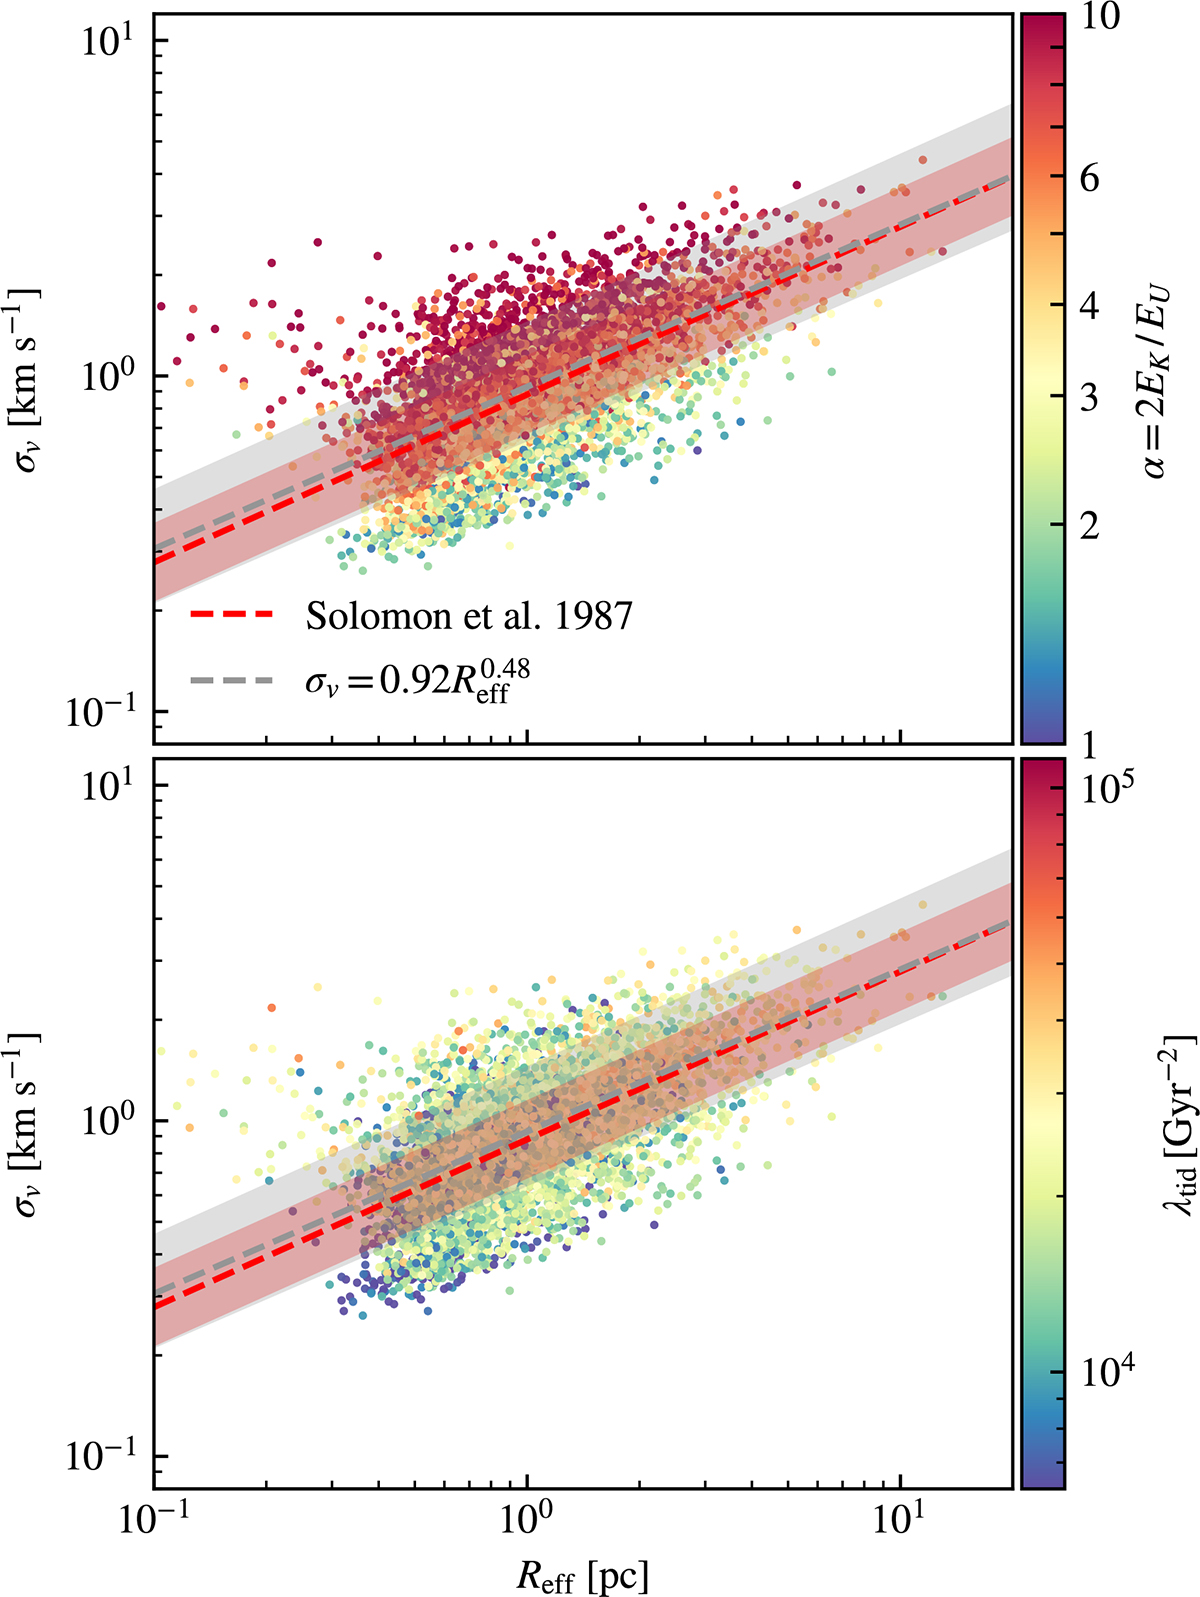
Download original image
Cloud velocity dispersion as a function of effective radius. The clouds are selected from the snapshot spaced at 10 Myr intervals to avoid duplicate counts and eliminate bias toward the long-lived clouds. The points in the top panel are color-coded by their virial parameters, while those in the bottom panel are color-coded by tidal strength λtid. Clouds in stronger tidal environments typically have larger velocity dispersions and virial parameters. The red line represents the observations of MW clouds by Solomon et al. (1987), and the red-shaded region represents the observed 0.22 dex dispersion of log10σv. The gray line and shaded region represent our best-fitting relation and the log10σv dispersion of 0.31 dex. Our sample fitting closely follows the observations, although the scatter in the sample is slightly larger than that of the observed MW clouds, due to a rather tolerant selection criterion designed to include dynamically diverse clouds.
Current usage metrics show cumulative count of Article Views (full-text article views including HTML views, PDF and ePub downloads, according to the available data) and Abstracts Views on Vision4Press platform.
Data correspond to usage on the plateform after 2015. The current usage metrics is available 48-96 hours after online publication and is updated daily on week days.
Initial download of the metrics may take a while.