Open Access
Fig. 6.
Download original image
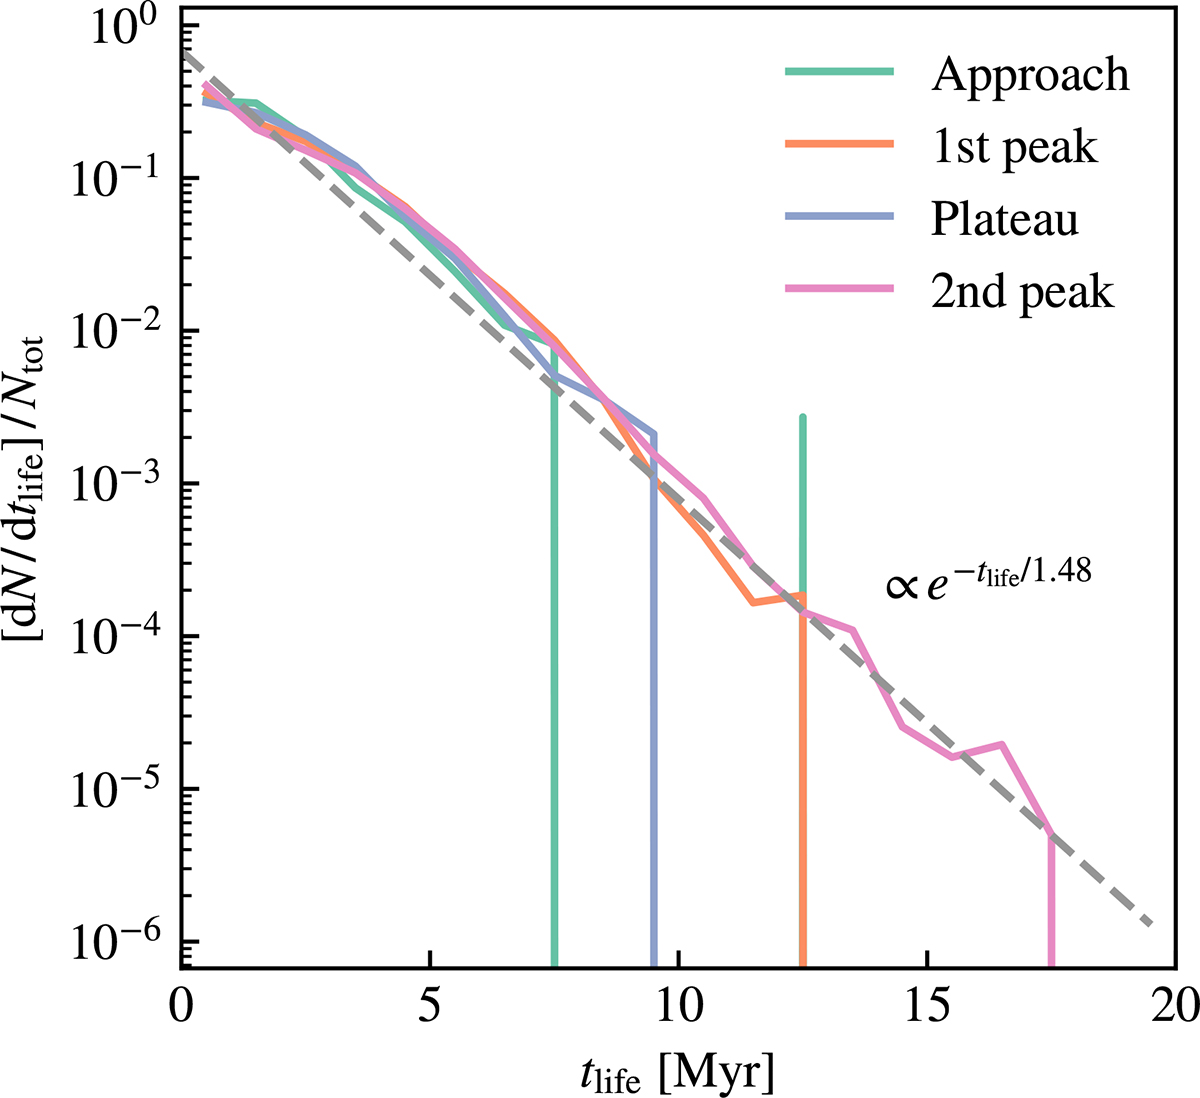
Cloud lifetime distributions at different merger stages. The dashed gray line denotes the maximum likelihood estimate fitting of the lifetime for all stages. The clouds in all merger stages follow the same exponentially decaying relation with a characteristic time of 1.48 Myr.
Current usage metrics show cumulative count of Article Views (full-text article views including HTML views, PDF and ePub downloads, according to the available data) and Abstracts Views on Vision4Press platform.
Data correspond to usage on the plateform after 2015. The current usage metrics is available 48-96 hours after online publication and is updated daily on week days.
Initial download of the metrics may take a while.