Fig. 9.
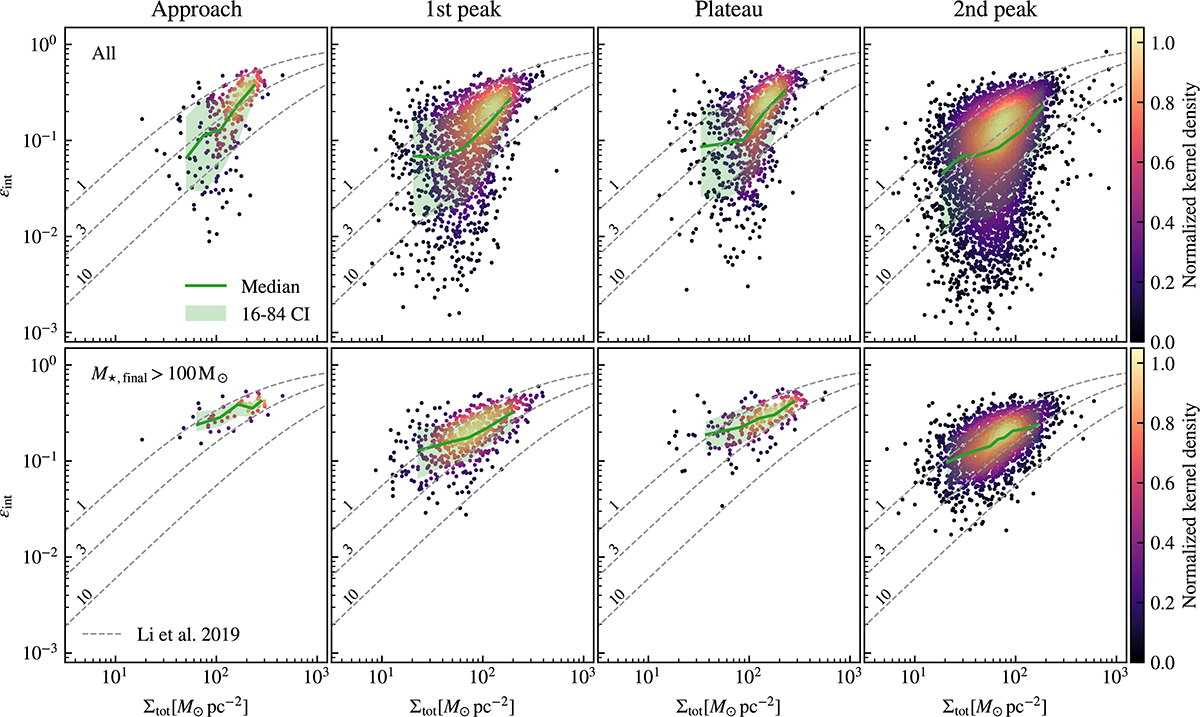
Download original image
Distribution of integrated SFE ϵint as a function of the total baryon surface density Σtot. Top panels: Distribution of all cloud samples with SF. Bottom panel: Results for the clouds formed more than 100 M⊙ in newly formed stars. The data points are color-coded by the normalized density in log-space estimated by a Gaussian kernel. The green curves show the median values, and the shaded regions indicate the 16–84 confidence levels. The dashed curves denote Equation (5) with the best-fitting parameters from Li et al. (2019) for fboost = 1, 3, and 10. Although the scatter of the simulated results is large, the median curve roughly follows the theoretical curve with fboost = 3. The 16–84 confidence level lies between the fboost = 1 and 10 curves at all the stages.
Current usage metrics show cumulative count of Article Views (full-text article views including HTML views, PDF and ePub downloads, according to the available data) and Abstracts Views on Vision4Press platform.
Data correspond to usage on the plateform after 2015. The current usage metrics is available 48-96 hours after online publication and is updated daily on week days.
Initial download of the metrics may take a while.