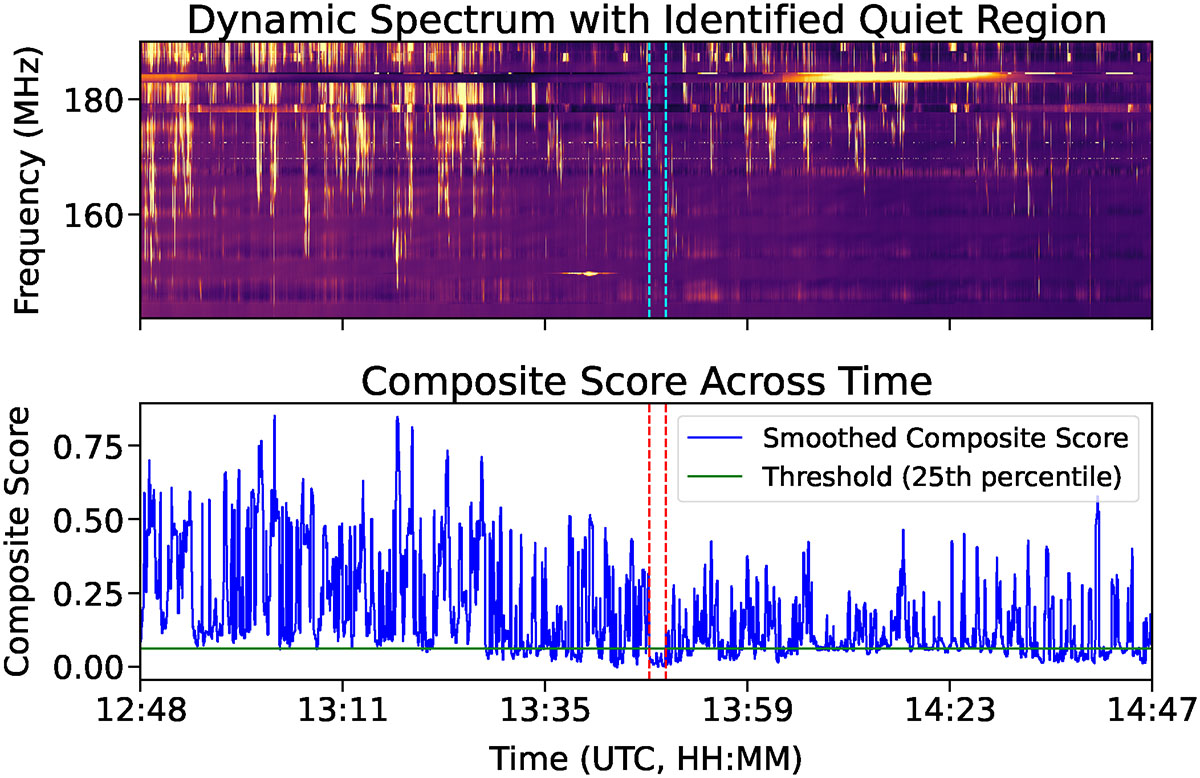
Fig. 5.
Download original image
Automated identification of a quiet calibration interval within contaminated calibrator data. The top panel shows the dynamic spectra of a calibrator observation (Cassiopeia A) contaminated by solar emission, with vertical dashed cyan lines marking the start and end of the automatically identified quiet interval. The bottom panel displays the smoothed composite score time series, derived from statistical measures of variability, non-Gaussianity, and entropy across sliding time windows. The horizontal green line marks the 25th percentile threshold used to define ‘quiet’ intervals. The selected segment (between red dashed lines, from 13:48:20 to 13:50:18 UTC) represents the longest continuous window below this threshold and is used for reliable calibration.
Current usage metrics show cumulative count of Article Views (full-text article views including HTML views, PDF and ePub downloads, according to the available data) and Abstracts Views on Vision4Press platform.
Data correspond to usage on the plateform after 2015. The current usage metrics is available 48-96 hours after online publication and is updated daily on week days.
Initial download of the metrics may take a while.