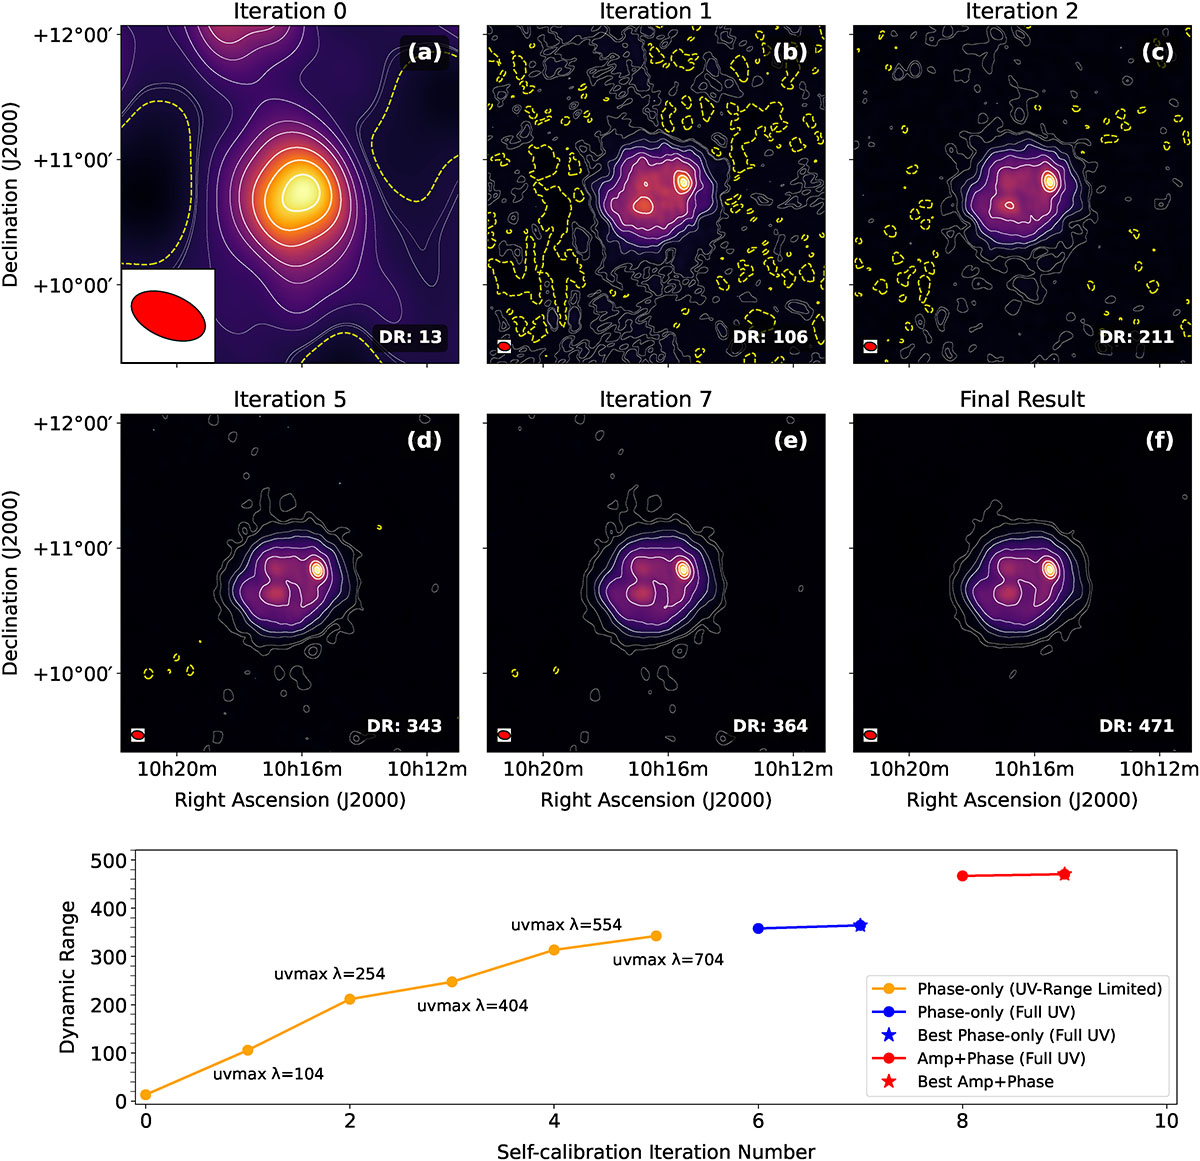
Fig. 6.
Download original image
Dynamic range and image quality improvement through self-calibration. The top two panels a–f show the improvement of imaging quality over multiple self-calibration iterations, demonstrated at 112.6 MHz with 1 s time integration and 1 MHz frequency averaging. White contour are drawn at 0.5%, 1%, 5%, 10%, 20%, 30%, 50%, 70%, and 90% of the peak intensity. The dashed yellow contour represents −1% of the peak intensity. The red ellipse in the bottom-left corner of each panel indicates the restoring beam. (a): Initial image (iteration 0), after applying only amplitude solutions from the calibrator and visibilities restricted to uv < 104 λ, allowing a simple Gaussian model to initiate phase-only self-calibration. (b): Image after first phase-only self-calibration using the Gaussian model; dynamic range (DR) improves to 106. (c): Phase-only self-calibration extended to uv < 254 λ for the second iteration further improves DR to 211. (d): After including baselines up to uv < 704 λ at iteration 5, DR increases to 343. (e): Final phase-only iteration with DR = 364. (f): Final image after amplitude-phase self-calibration converges; DR reaches 471. Bottom panel: Dynamic range variations across self-calibration cycles. Each point represents an iteration, and the maximum baseline length used (uvmax) is indicated in the figure. Phase-only calibration steps are shown in blue and yellow, amplitude-phase steps in red. Star markers indicate the best dynamic range achieved in each stage. The improvement in image fidelity through iterative self-calibration is evident.
Current usage metrics show cumulative count of Article Views (full-text article views including HTML views, PDF and ePub downloads, according to the available data) and Abstracts Views on Vision4Press platform.
Data correspond to usage on the plateform after 2015. The current usage metrics is available 48-96 hours after online publication and is updated daily on week days.
Initial download of the metrics may take a while.