Fig. 7.
Download original image
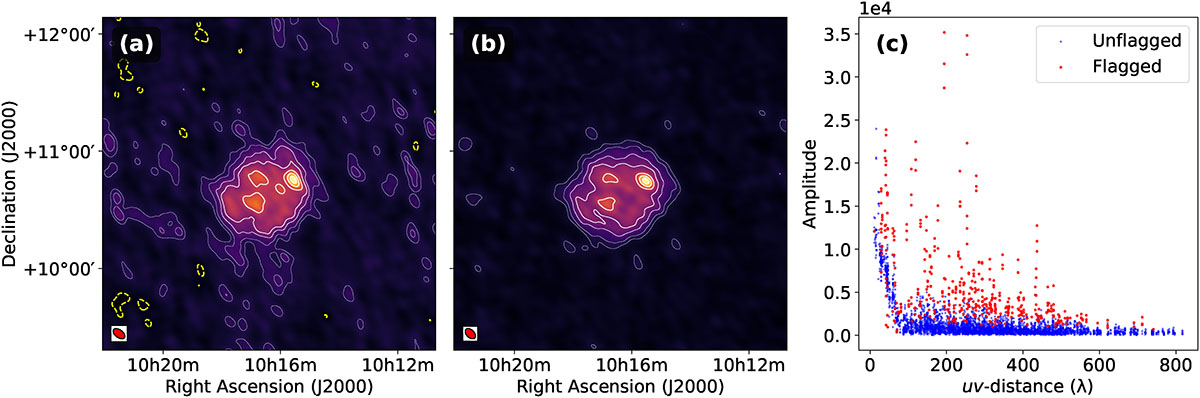
uv-domain based flagging on solar visibilites. Panels a and b show solar images at the same frequency and time, before and after SIMPL’s uv-based flagging, respectively. These are at 111.13 MHz with 1 s time integration and 195.3 kHz frequency averaging, and are severely affected by RFI. For panels a and b, white contours are drawn at 5%, 10%, 20%, 30%, 50%, 70%, and 90% of the peak intensity and the dashed yellow contour represents the −5% of the peak intensity. The restoring beam is show in red in the bottom-left corners. Image a exhibits an rms of 13.7 Jy/beam and a dynamic range of 37, while the image b, obtained after outlier flagging followed by another round of self-calibration, shows an improved rms of 7.5 Jy/beam and a dynamic range of 74. Panel c illustrates the corresponding visibility amplitudes as a function of uv-distance. Flagged visibilities (red) were identified as outliers as detailed in Section 5.5. This approach enables effective suppression of corrupted visibilities while preserving genuine solar structure across spatial scales.
Current usage metrics show cumulative count of Article Views (full-text article views including HTML views, PDF and ePub downloads, according to the available data) and Abstracts Views on Vision4Press platform.
Data correspond to usage on the plateform after 2015. The current usage metrics is available 48-96 hours after online publication and is updated daily on week days.
Initial download of the metrics may take a while.