Fig. 9.
Download original image
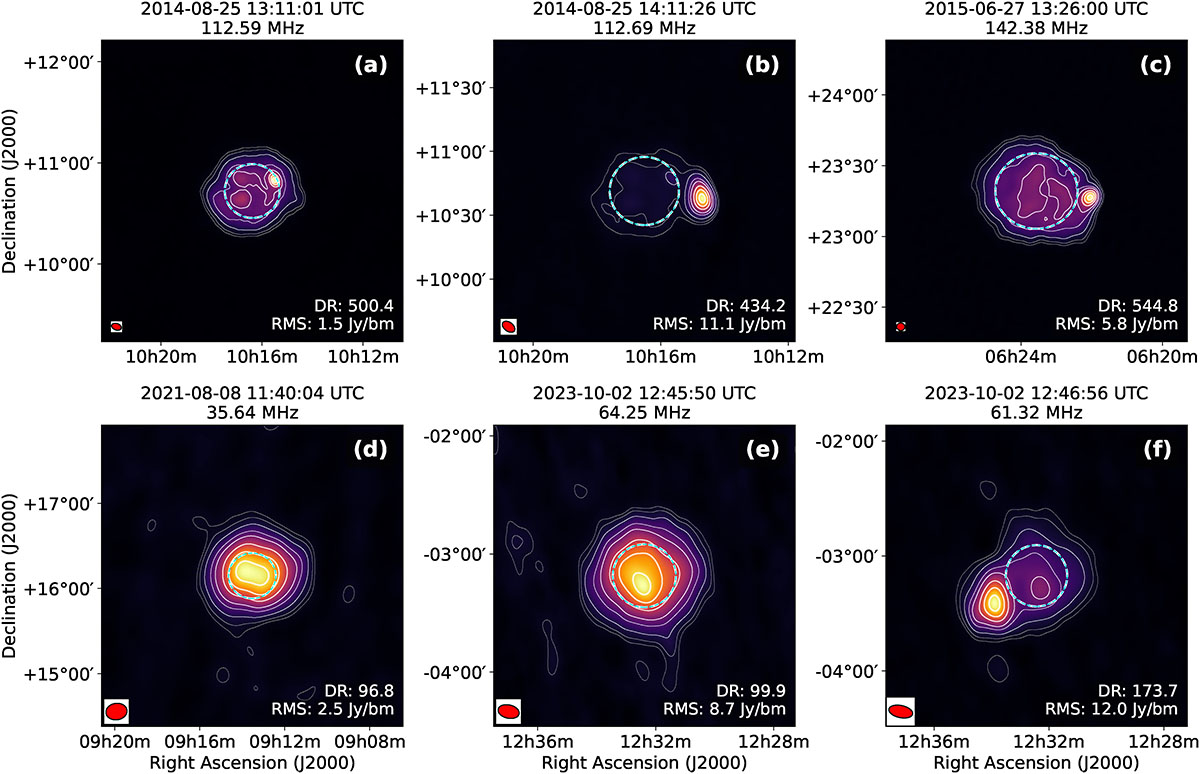
Examples of spectroscopic snapshot images produced by SIMPL in its default mode. All images are generated using 1 s integration and 195.3 kHz frequency averaging, except for panel d, which was integrated over 1 s and 1 MHz. Contours are drawn at 3%, 5%, 10%, 20%, 30%, 50%, 70%, and 90% of the maximum intensity in each image. The red ellipse in the bottom-left corner of each panel indicates the restoring beam, and the dashed cyan circles represent the optical solar disc. Top panels a–c: HBA observations. Panels a and c show examples of noise storm emission. Panel b displays a bright type III radio burst, more than an order of magnitude more intense than the noise storm in panel a. Low-level contours reveal the quiet Sun emission even in the presence of strong radio sources. Bottom panels d–f: LBA observations. Panel d shows a quiet Sun snapshot at 35.64 MHz with a dynamic range of 104. Panels e and f correspond to snapshots immediately before and during a type II burst. The quiet Sun remains visible in the low-level contours, even in panel f, despite the presence of an intense burst.
Current usage metrics show cumulative count of Article Views (full-text article views including HTML views, PDF and ePub downloads, according to the available data) and Abstracts Views on Vision4Press platform.
Data correspond to usage on the plateform after 2015. The current usage metrics is available 48-96 hours after online publication and is updated daily on week days.
Initial download of the metrics may take a while.