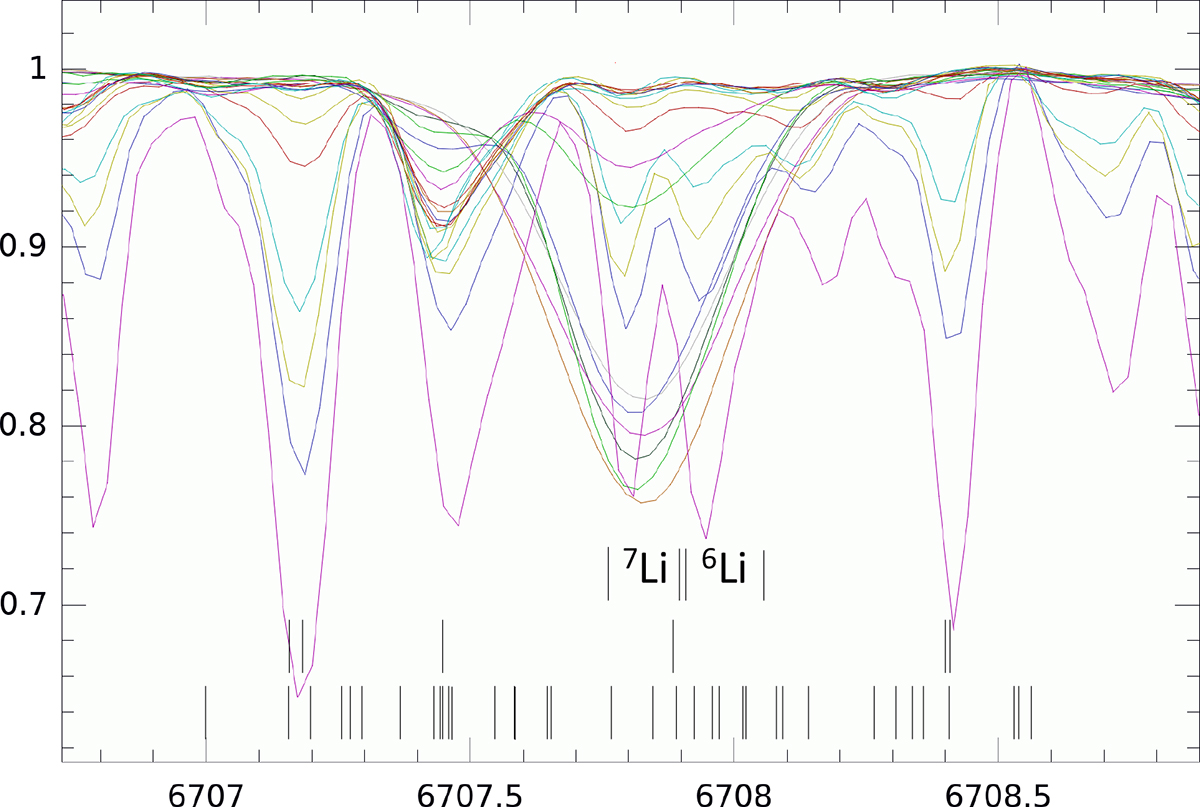
Fig. 2.
Download original image
Comparison of the lithium 6707.8-Å region for our sample stars. We show the phase-combined spectra. The short vertical dashes indicate the wavelengths of blending lines. The bottom row of dashes shows the line list from Strassmeier & Steffen (2022), the middle row shows the strongest CaH and TiO lines from the solar umbral atlas, and the upper four dashes indicate the two 7Li and 6Li doublets, respectively. The x-axis is the wavelength in Ångstroem.
Current usage metrics show cumulative count of Article Views (full-text article views including HTML views, PDF and ePub downloads, according to the available data) and Abstracts Views on Vision4Press platform.
Data correspond to usage on the plateform after 2015. The current usage metrics is available 48-96 hours after online publication and is updated daily on week days.
Initial download of the metrics may take a while.