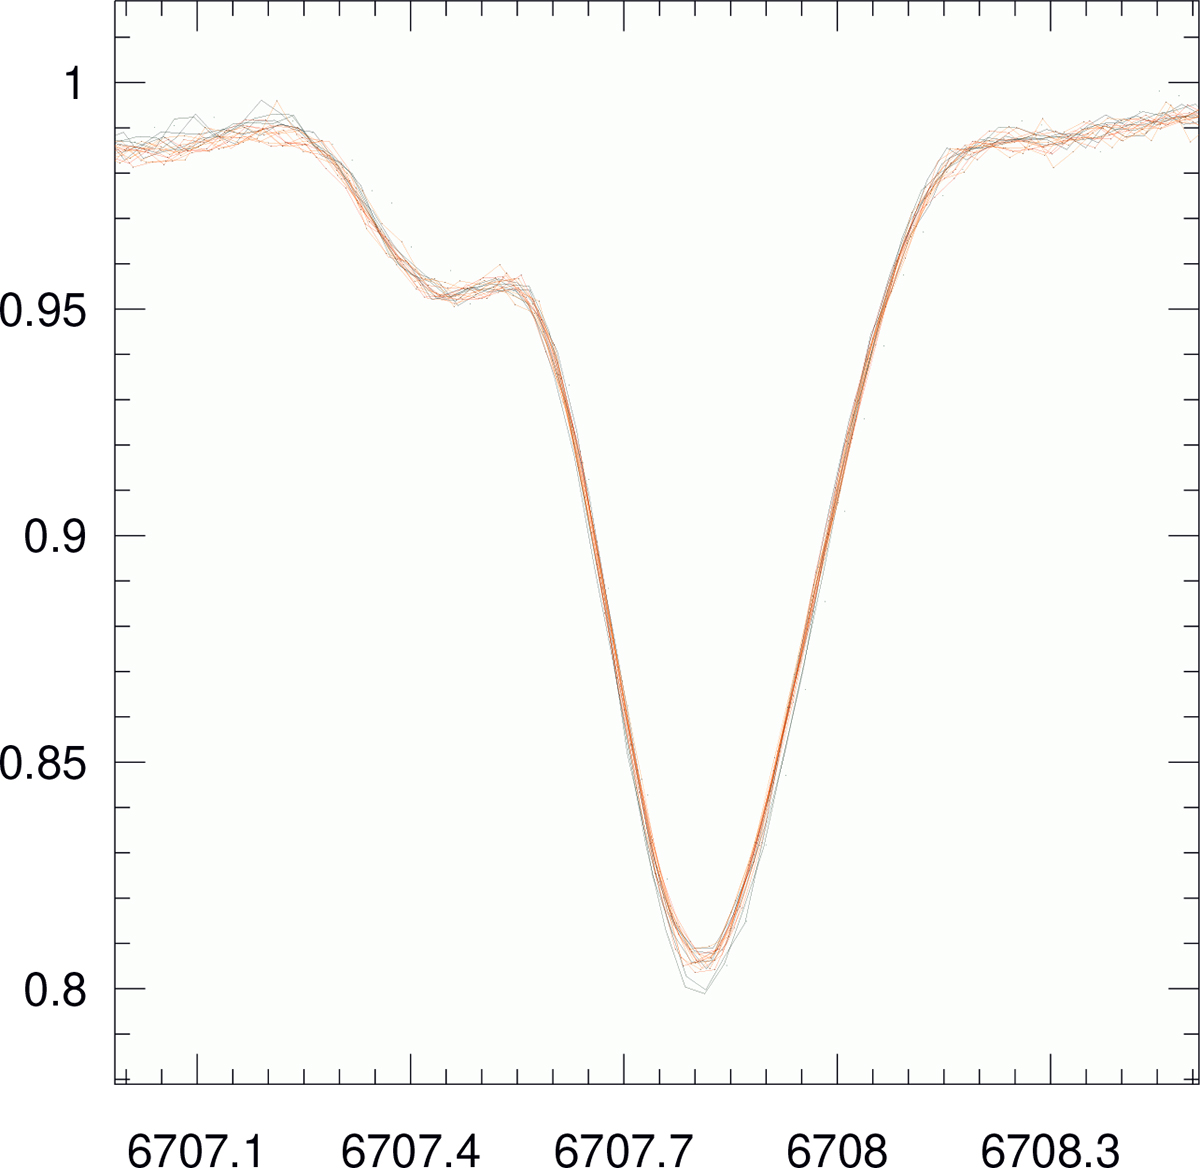
Fig. 3.
Download original image
Nineteen individual Li I 6707.8-Å line profiles of RSP 177 (Teff = 5770 K). It indicates the expected range of line-core changes over time. The black profiles are from 2020 (season S20), and the red profiles are from 2022 (season S22), according to Table C.1. The maximum line-core variability in this case is 0.8%. The x-axis is the wavelength in Ångstroem.
Current usage metrics show cumulative count of Article Views (full-text article views including HTML views, PDF and ePub downloads, according to the available data) and Abstracts Views on Vision4Press platform.
Data correspond to usage on the plateform after 2015. The current usage metrics is available 48-96 hours after online publication and is updated daily on week days.
Initial download of the metrics may take a while.