Fig. B.2.
Download original image
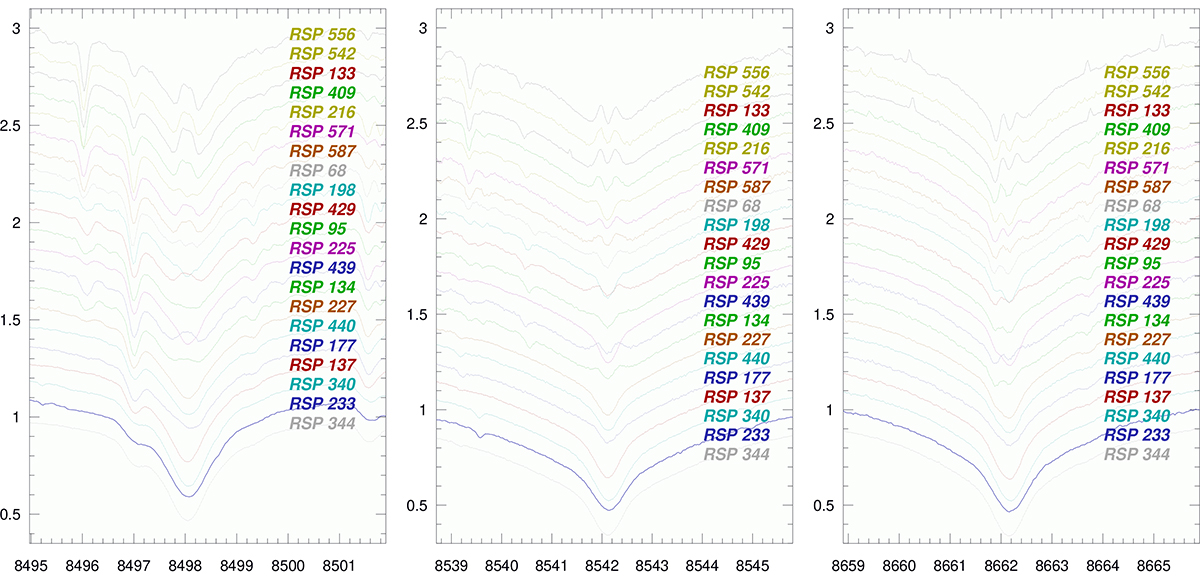
Ca II IRT line profiles. From left to right: IRT-1 (8498 Å), IRT-2 (8542 Å), and IRT-3 (8662 Å). Targets are arranged with increasing rotation period from bottom to top; each spectrum is consecutively shifted in intensity by 0.1 for better visibility. Targets are identified on the right side of each plot. The x-axis is wavelength in Ångstroem.
Current usage metrics show cumulative count of Article Views (full-text article views including HTML views, PDF and ePub downloads, according to the available data) and Abstracts Views on Vision4Press platform.
Data correspond to usage on the plateform after 2015. The current usage metrics is available 48-96 hours after online publication and is updated daily on week days.
Initial download of the metrics may take a while.