Fig. 13
Download original image
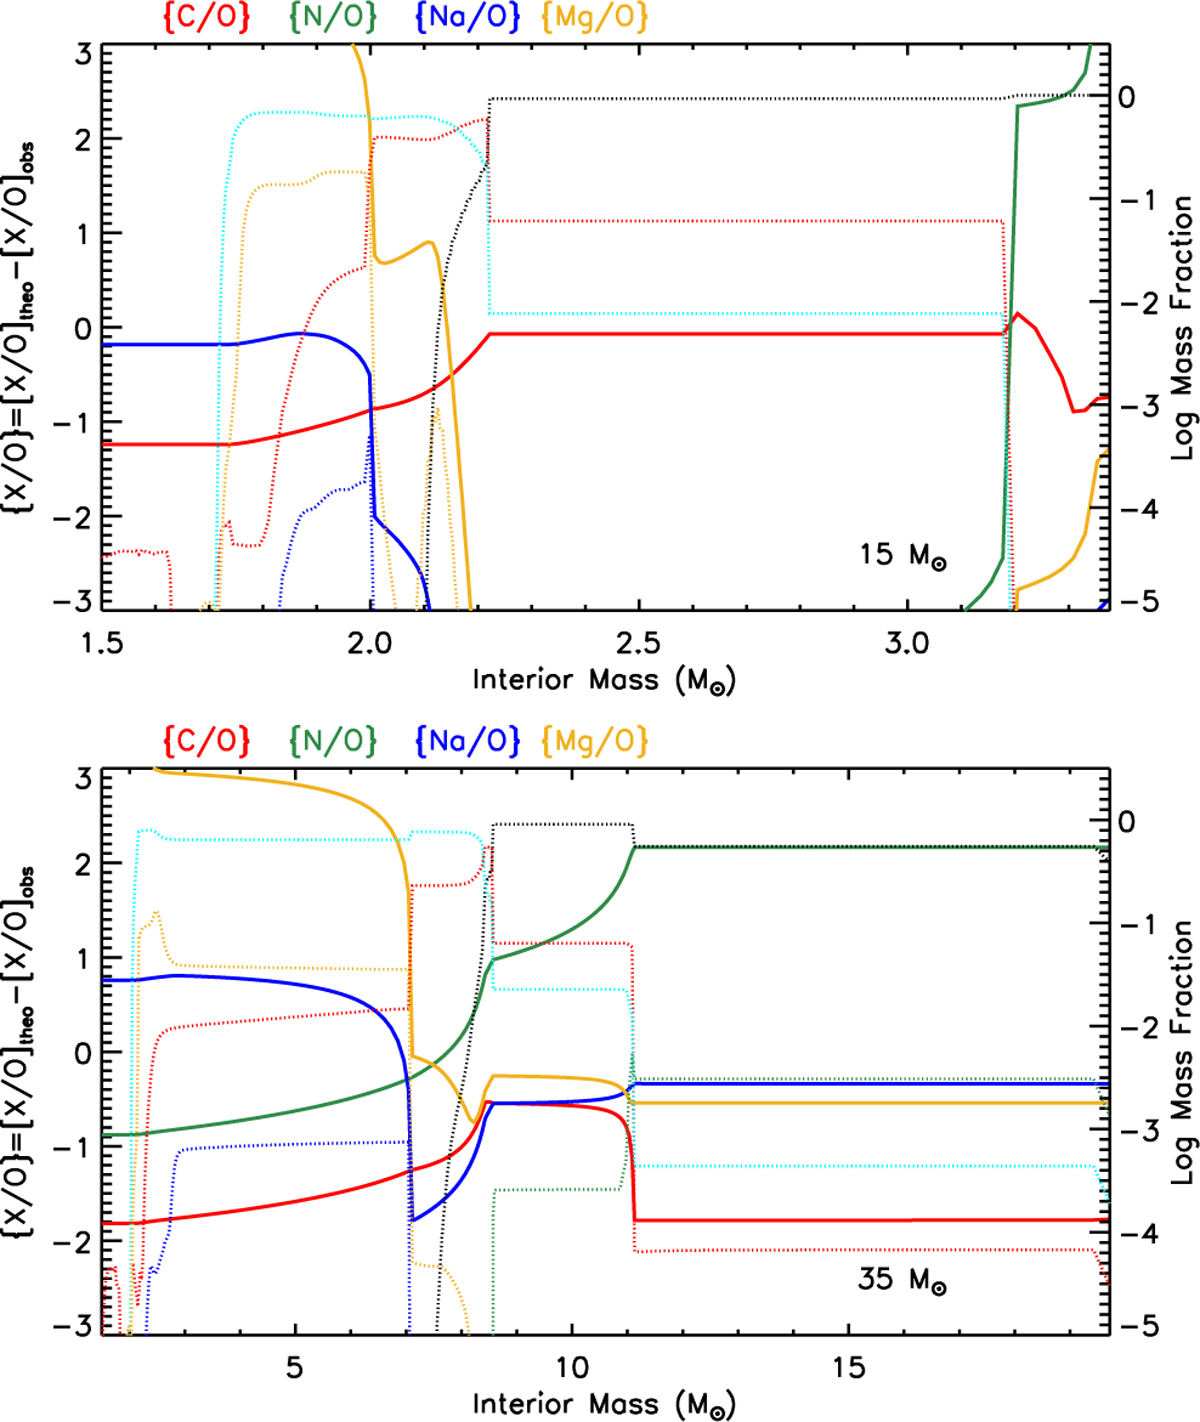
Abundance ratios of C,N, Na, and Mg/O as a function of remnant mass for a zero-metallicity 15 M⊙ (top) and 35 M⊙ (bottom) star (Limongi & Chieffi 2012) after the explosion (bold sold lines, left y-axis). The abundance ratio X/O is defined as the difference between the predicted and observed [X/O] values. The right y-axis shows postexplosion interior profiles of 4He (dotted black line), 12C (red), 16O (cyan), 23Na (blue), and 24Mg (orange).
Current usage metrics show cumulative count of Article Views (full-text article views including HTML views, PDF and ePub downloads, according to the available data) and Abstracts Views on Vision4Press platform.
Data correspond to usage on the plateform after 2015. The current usage metrics is available 48-96 hours after online publication and is updated daily on week days.
Initial download of the metrics may take a while.