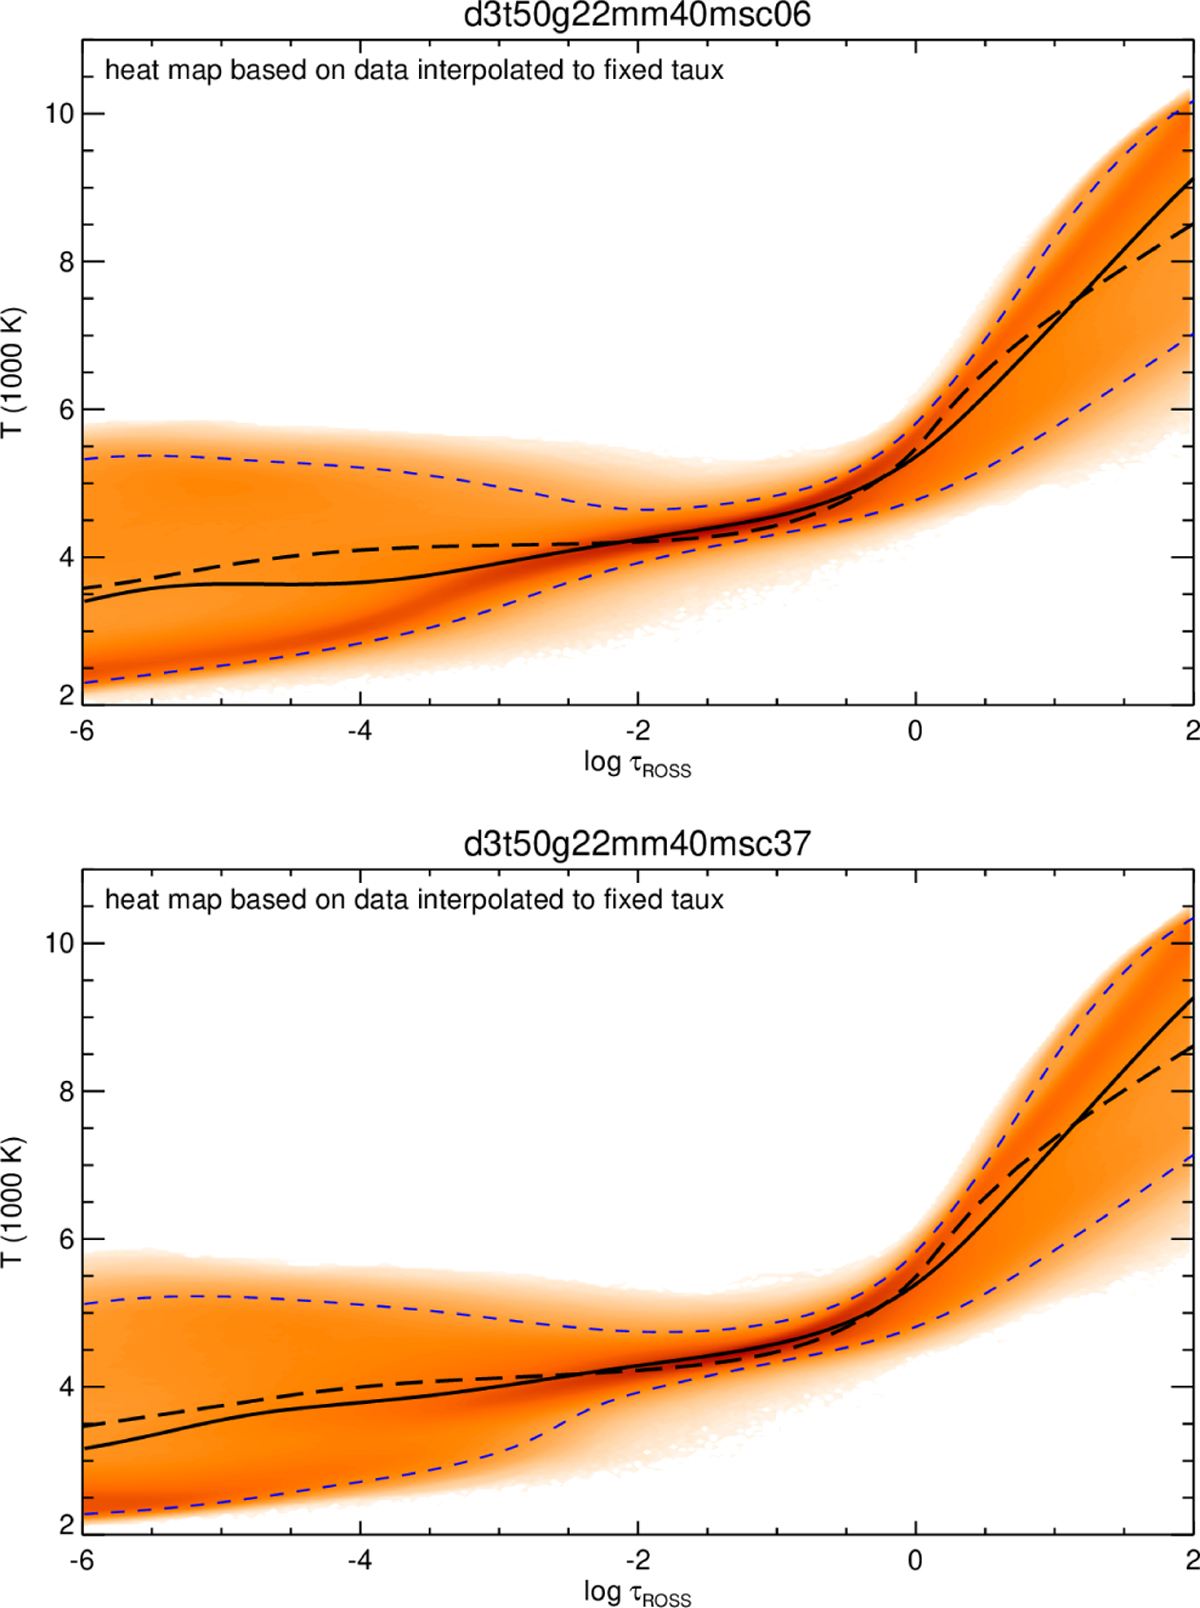
Fig. B.1
Download original image
3D versus 1D temperature structure of two 3D CO5BOLD models representing HE 0107–5240 (Teff ∼ 5090 K, log g = 2.2, [M/H]=−4.0, α enhancement +0.4), assuming different CNO abundances for computing the opacity tables: Top: A(C)=4.39, A (N)=3.78, A(O)=5.06; Bottom: A(C)=7.39, A(N)=6.78, A(O)=7.66. The orange band outlines the 3D temperature distribution constructed from 20 snapshots of the respective high-resolution model, each resampled to 144 × 144 × 200 grid points. The dashed blue lines enclose 95.5% of the data points at given Rosseland optical depth. The black solid line shows the <3D> model (the temperature of the 3D model averaged at constant τRoss), the black long-dashed line represents the T(τRoss) relation of the 1D LHD reference model atmosphere with identical stellar parameters, treating convection by standard mixing-length theory, but otherwise using the same input physics as the 3D hydrodynamical model.
Current usage metrics show cumulative count of Article Views (full-text article views including HTML views, PDF and ePub downloads, according to the available data) and Abstracts Views on Vision4Press platform.
Data correspond to usage on the plateform after 2015. The current usage metrics is available 48-96 hours after online publication and is updated daily on week days.
Initial download of the metrics may take a while.