Open Access
Fig. 8
Download original image
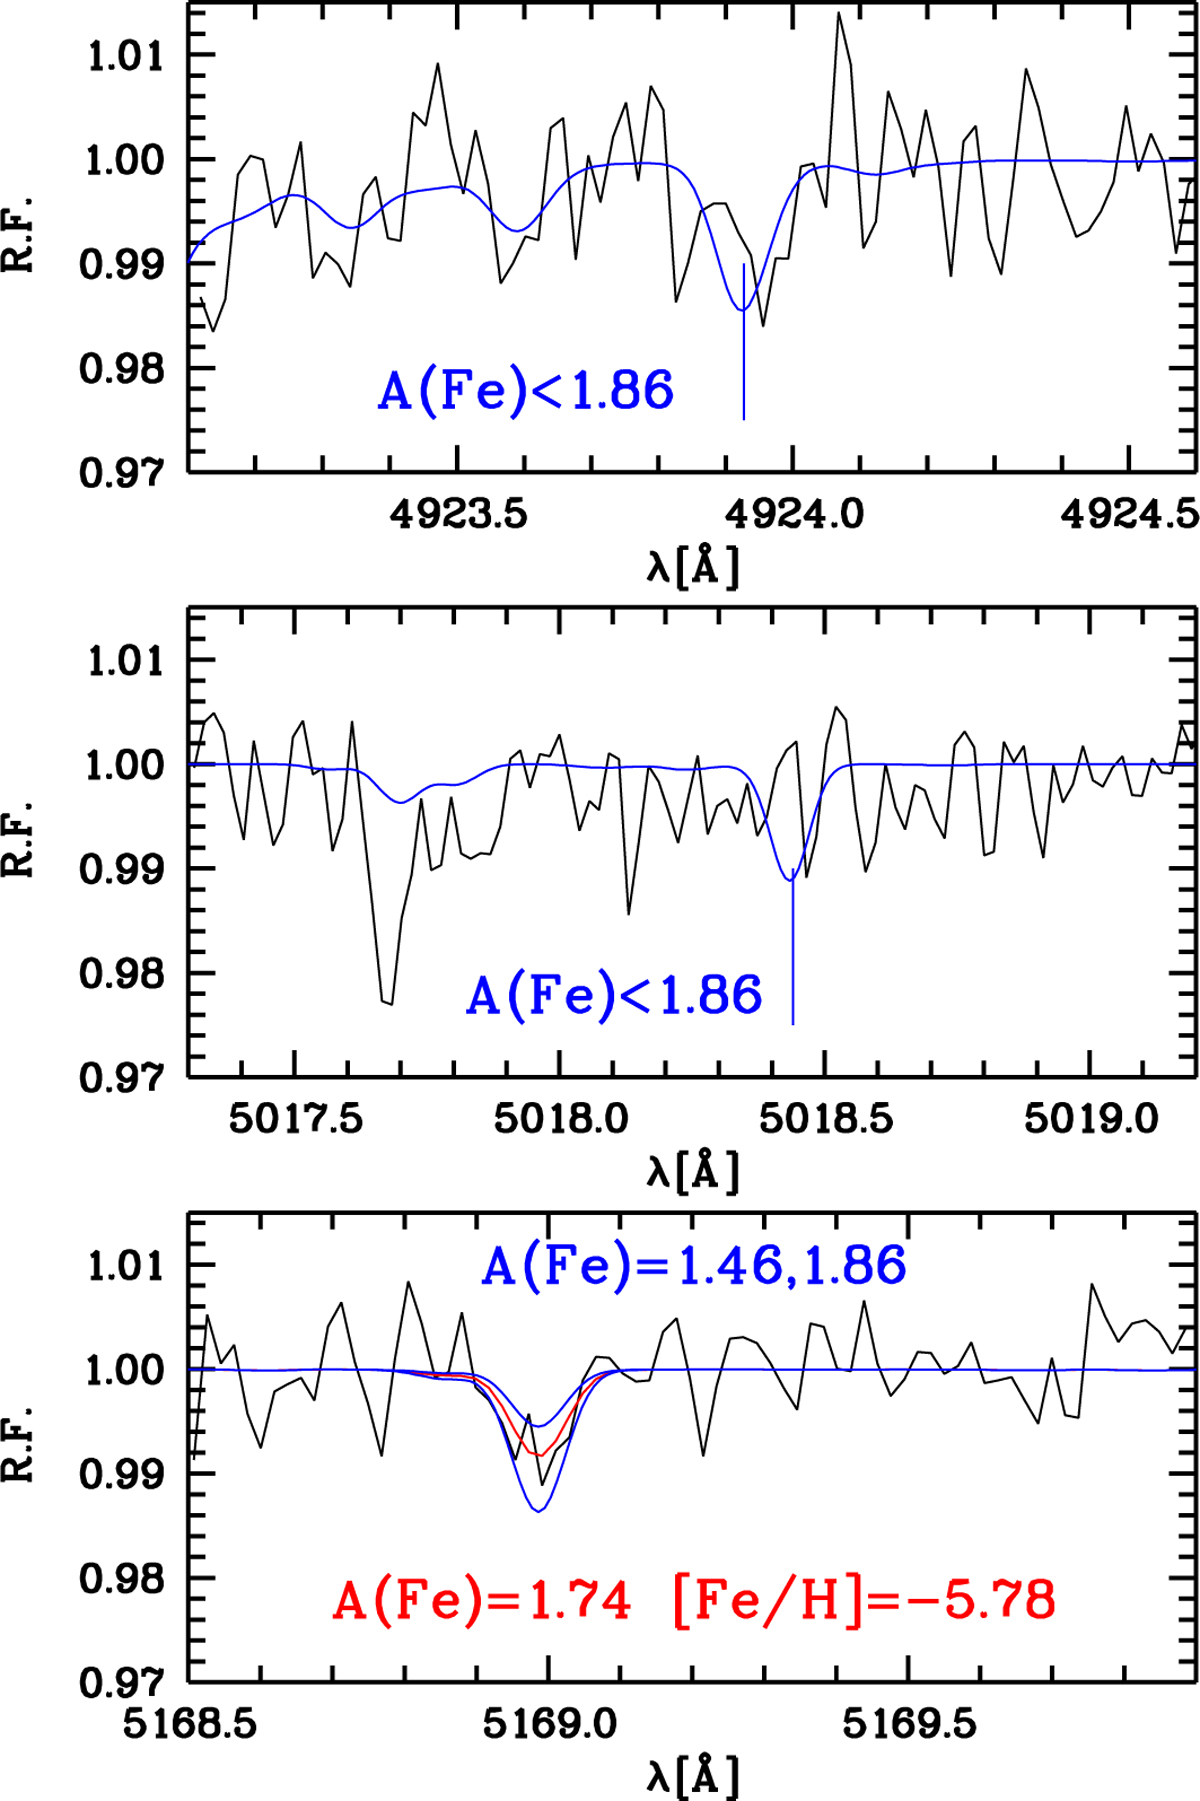
Observed spectra (black line; from top to bottom Fe II 492.3, 501.8, and 516.9 nm), compared to the best fit (red line) and the synthetic profile used to illustrate uncertainty and upper limit (blue line).
Current usage metrics show cumulative count of Article Views (full-text article views including HTML views, PDF and ePub downloads, according to the available data) and Abstracts Views on Vision4Press platform.
Data correspond to usage on the plateform after 2015. The current usage metrics is available 48-96 hours after online publication and is updated daily on week days.
Initial download of the metrics may take a while.