Fig. 3
Download original image
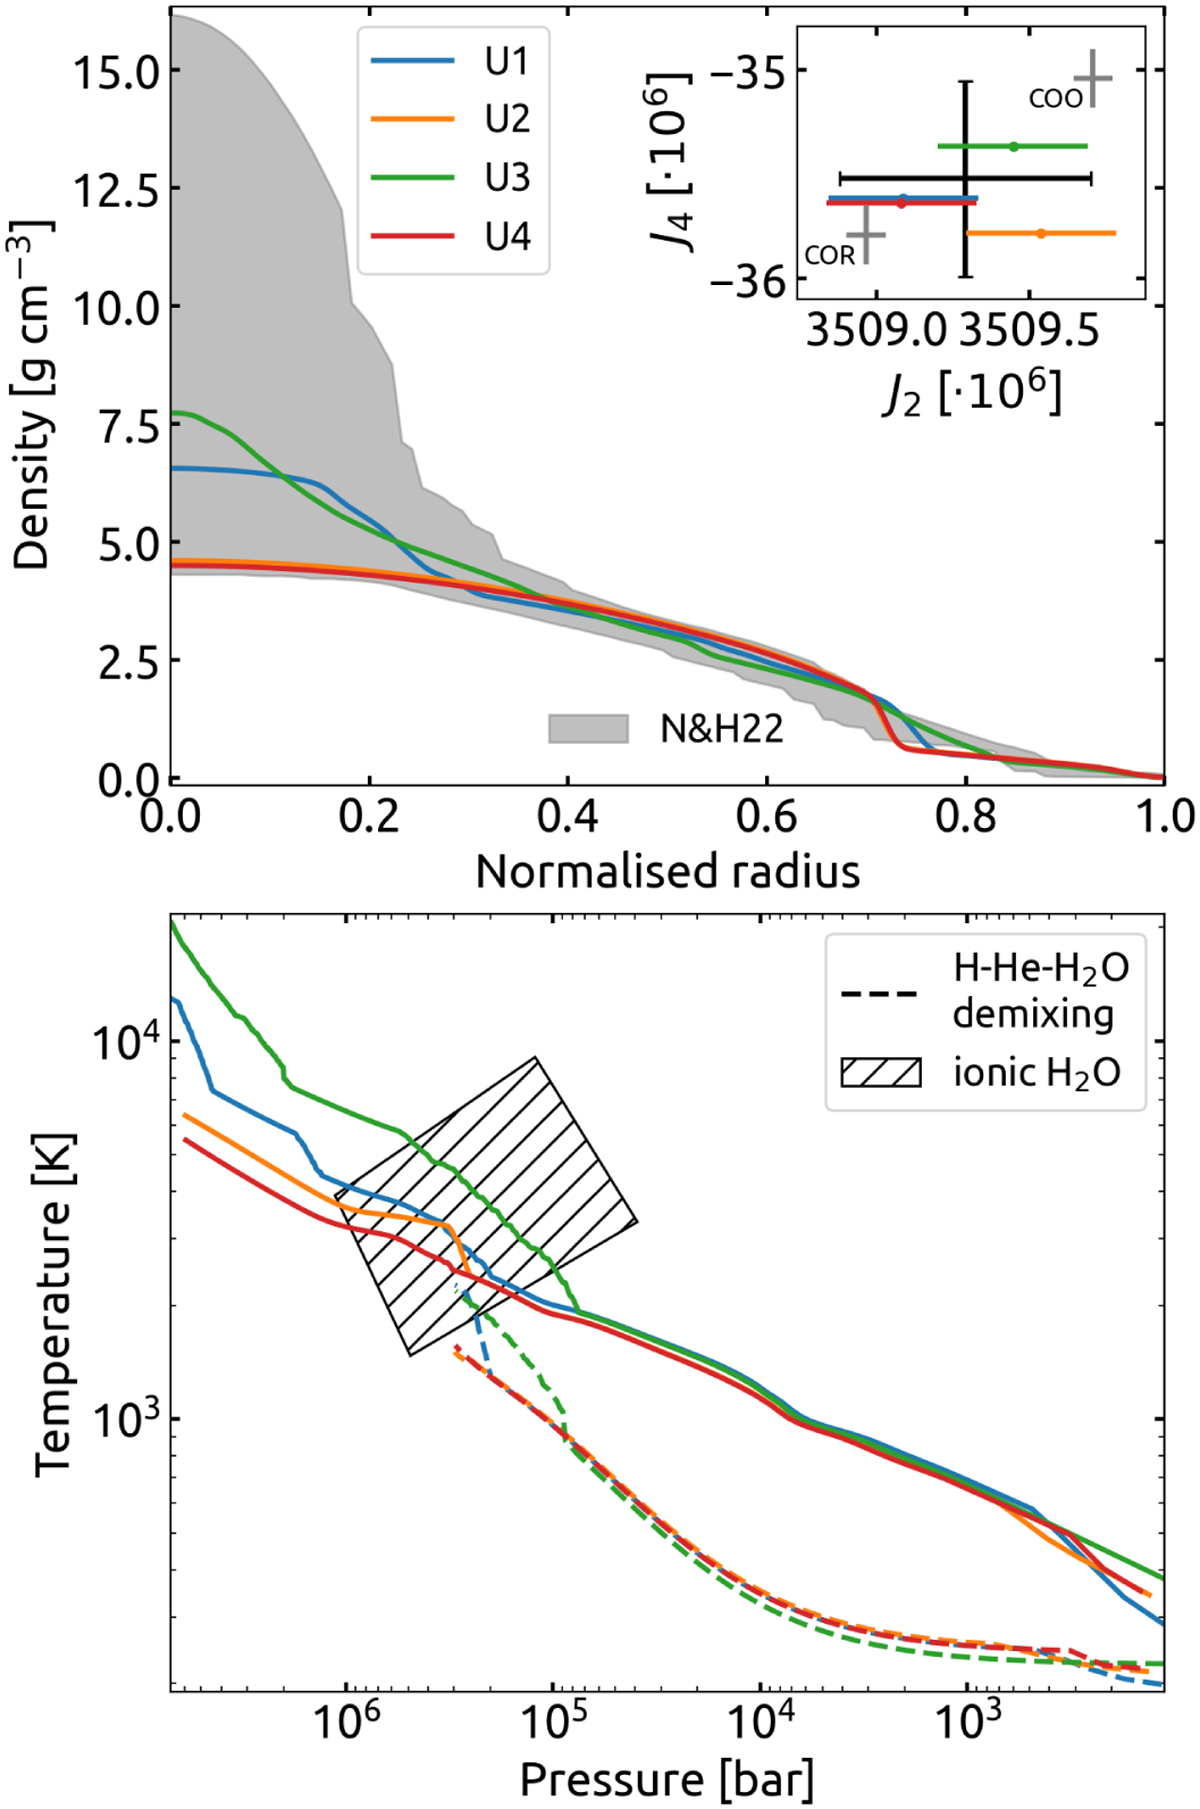
Density, pressure, and temperature profiles for the four Uranus models. Top: density versus normalised radius. For comparison, also shown are empirical solutions from Neuenschwander & Helled (2022) (grey area). The panel in the top right shows Uranus’ measured (French et al. 2024, black) and calculated (coloured) gravitational moments. We also show Uranus’ gravitational moments according to Jacobson & Park (2025) (grey) who find different results (COR vs COO) corresponding to different ring centre definitions. The coloured uncertainties depict estimated errors from the Theory of Figures. Bottom: temperature versus pressure. Also shown is the predicted region of ionic water inferred by Redmer et al. (2011). The dashed lines show the demixing line, below which hydrogen, helium, and water are expected to become immiscible (Howard et al. 2025).
Current usage metrics show cumulative count of Article Views (full-text article views including HTML views, PDF and ePub downloads, according to the available data) and Abstracts Views on Vision4Press platform.
Data correspond to usage on the plateform after 2015. The current usage metrics is available 48-96 hours after online publication and is updated daily on week days.
Initial download of the metrics may take a while.