Fig. 1.
Download original image
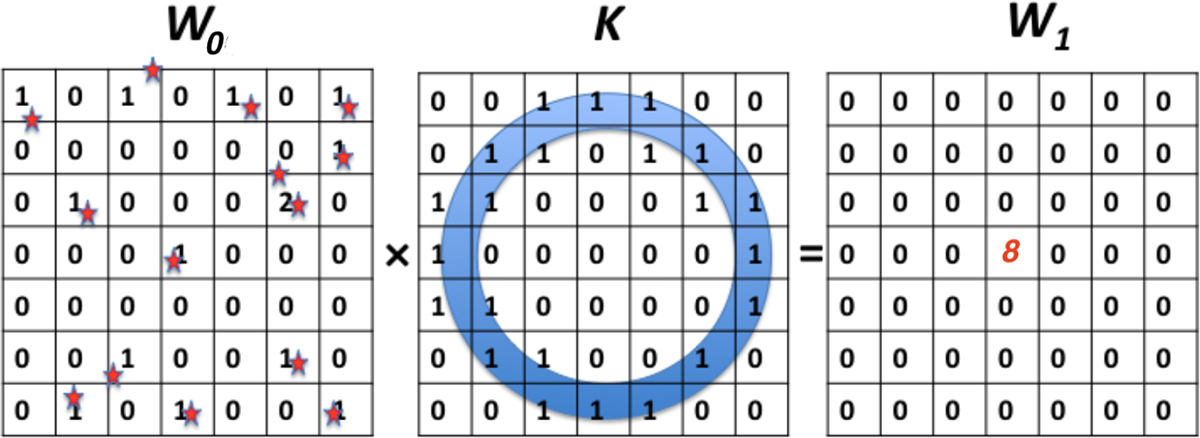
Two-dimensional schematic of how ConKer algorithm evaluates density field with W0 and W1. This shows the convolution of the matter-density variation field, W0 = D − R (left), with a spherical shell kernel, K, with a radius of s and width of Δs. The resulting product is the density histogram, W1 (right). In this example, the inner product is eight, which is placed in the center cell of the W1 grid. The kernel center iterates over each cell, performing this convolution at each scale s.
Current usage metrics show cumulative count of Article Views (full-text article views including HTML views, PDF and ePub downloads, according to the available data) and Abstracts Views on Vision4Press platform.
Data correspond to usage on the plateform after 2015. The current usage metrics is available 48-96 hours after online publication and is updated daily on week days.
Initial download of the metrics may take a while.