Fig. 4.
Download original image
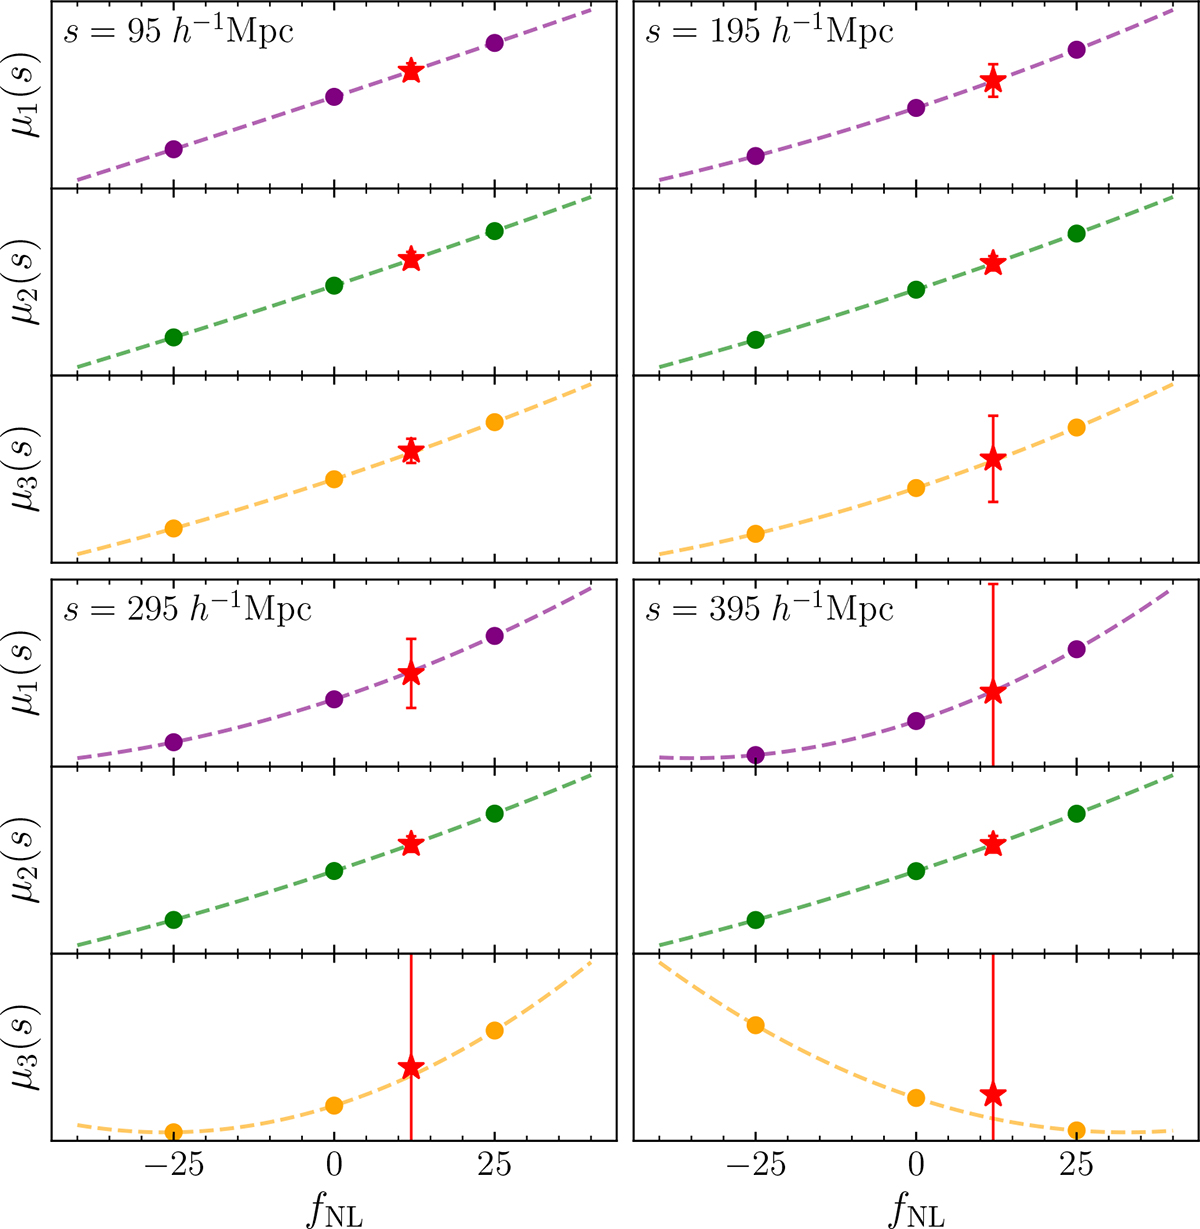
First (purple), second (green), and third (orange) moments plotted as a function of fNL for the same s bins as in Fig. 2. Each point represents the average moment computed from the 125 FastPM-L1 simulations at fNL = −25, 0, and 25, comprising the observation vector, ![]() (with each moment plotted separately). Dashed lines indicate the quadratic fit; i.e., the expectation vector
(with each moment plotted separately). Dashed lines indicate the quadratic fit; i.e., the expectation vector ![]() . The fNL = 12 test case is shown as a red star, with error bars representing the standard error on μ across the 125 simulations.
. The fNL = 12 test case is shown as a red star, with error bars representing the standard error on μ across the 125 simulations.
Current usage metrics show cumulative count of Article Views (full-text article views including HTML views, PDF and ePub downloads, according to the available data) and Abstracts Views on Vision4Press platform.
Data correspond to usage on the plateform after 2015. The current usage metrics is available 48-96 hours after online publication and is updated daily on week days.
Initial download of the metrics may take a while.