Open Access
Fig. 5.
Download original image
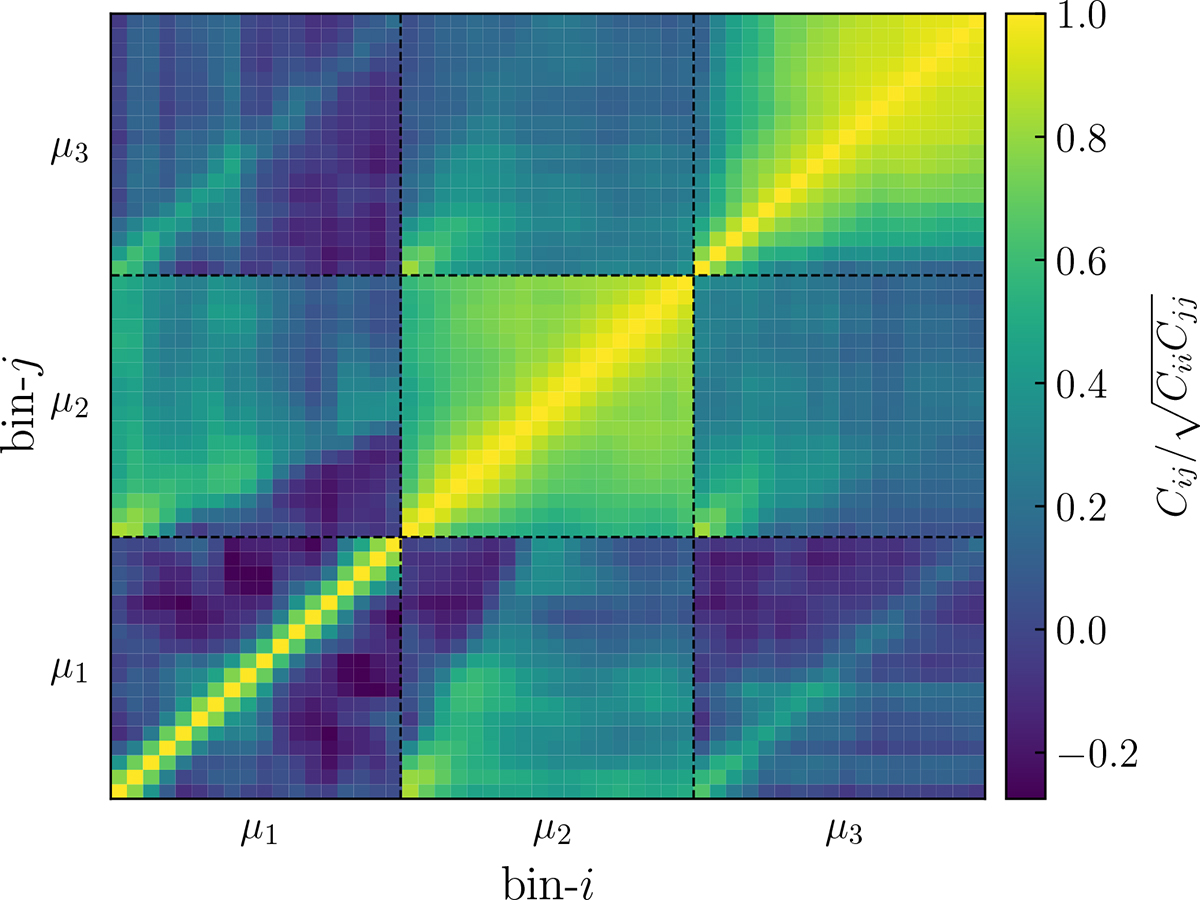
Correlation matrix (![]() ) computed from 125 fNL = 0 simulations using Eq. (21). The matrix here was derived using the full observation vector out to smax = 395 h−1 Mpc (54 total bins, 18 per moment). Dashed lines separate the blocks corresponding to different moments in the observation vector,
) computed from 125 fNL = 0 simulations using Eq. (21). The matrix here was derived using the full observation vector out to smax = 395 h−1 Mpc (54 total bins, 18 per moment). Dashed lines separate the blocks corresponding to different moments in the observation vector, ![]() .
.
Current usage metrics show cumulative count of Article Views (full-text article views including HTML views, PDF and ePub downloads, according to the available data) and Abstracts Views on Vision4Press platform.
Data correspond to usage on the plateform after 2015. The current usage metrics is available 48-96 hours after online publication and is updated daily on week days.
Initial download of the metrics may take a while.