Fig. 7.
Download original image
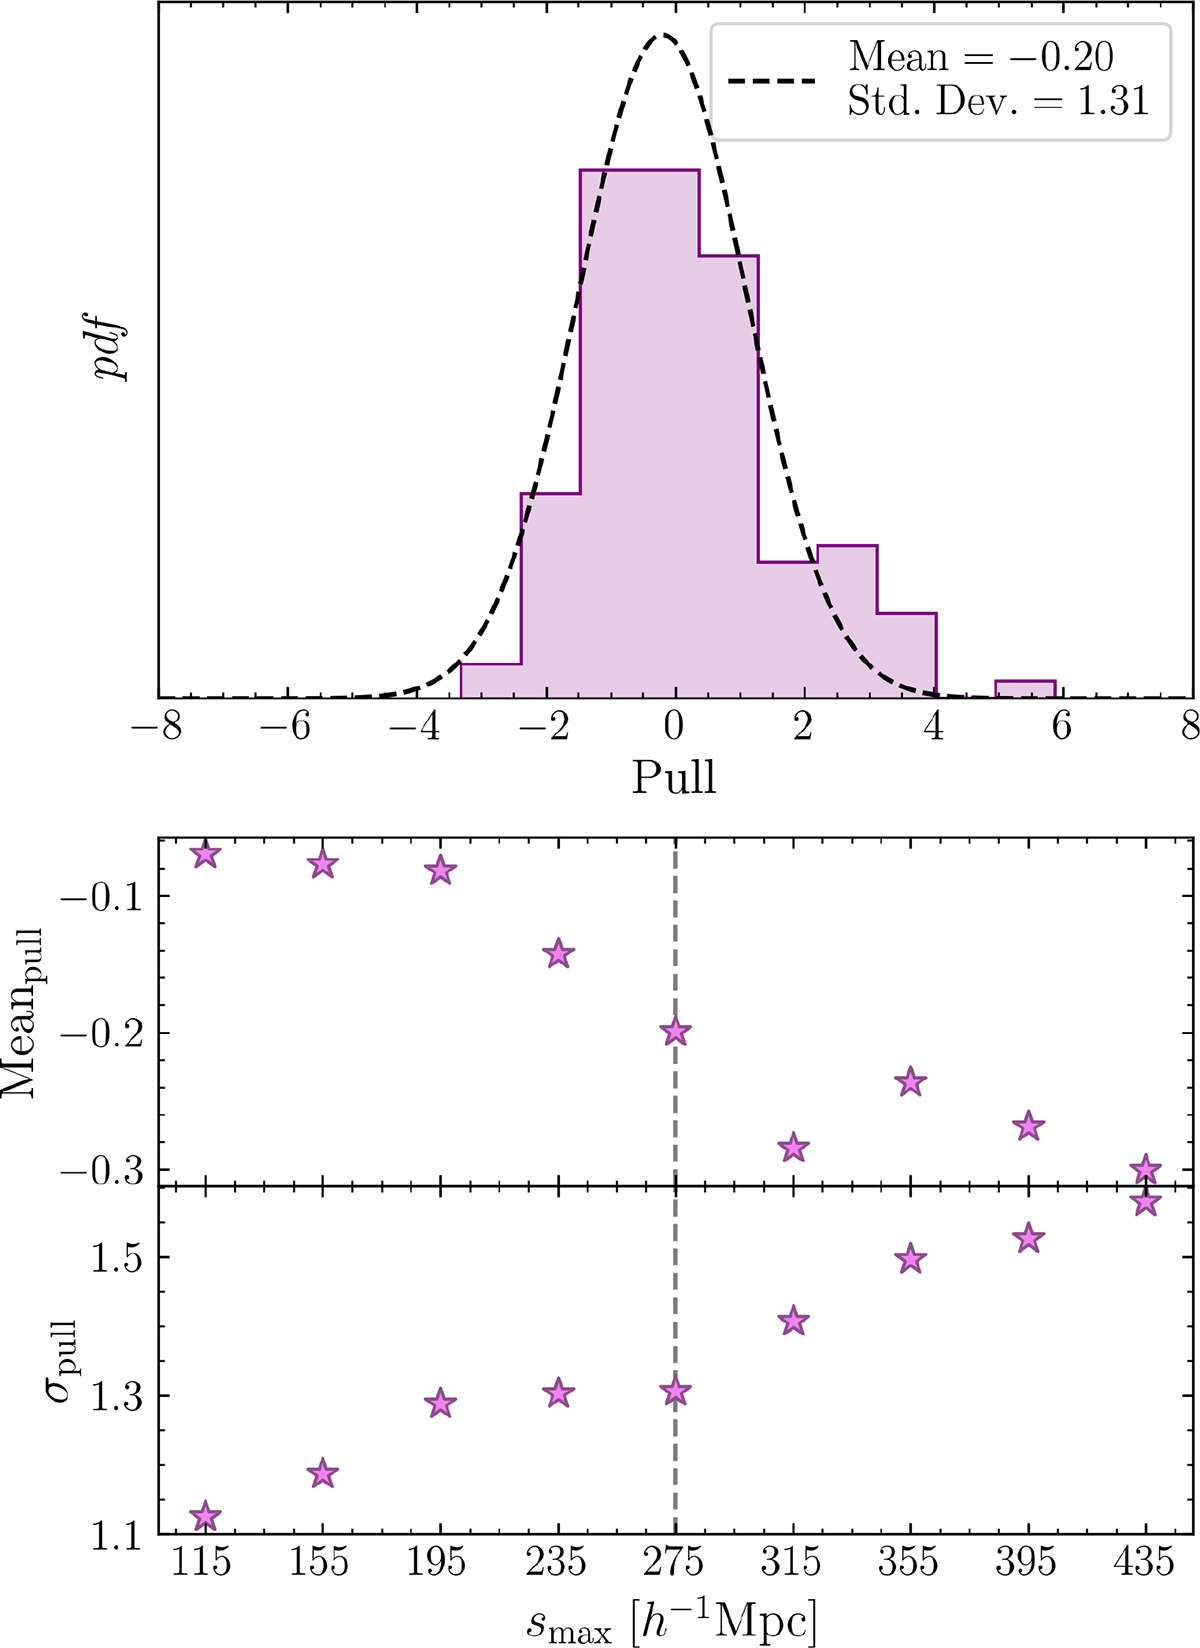
Top panel: Distribution of pull statistic (Eq. (23)) computed from 125 fNL = 12 simulations (purple). A Gaussian fit to the central region (−3 < Pull < 3; dashed line) yields a mean of −0.20 and standard deviation of 1.31. Bottom panel: Mean and standard deviation of pull distribution as a function of smax, the largest radial bin included in the analysis. The dashed vertical line marks the adopted value smax = 275 h−1 Mpc used in the test case.
Current usage metrics show cumulative count of Article Views (full-text article views including HTML views, PDF and ePub downloads, according to the available data) and Abstracts Views on Vision4Press platform.
Data correspond to usage on the plateform after 2015. The current usage metrics is available 48-96 hours after online publication and is updated daily on week days.
Initial download of the metrics may take a while.