Fig. 8.
Download original image
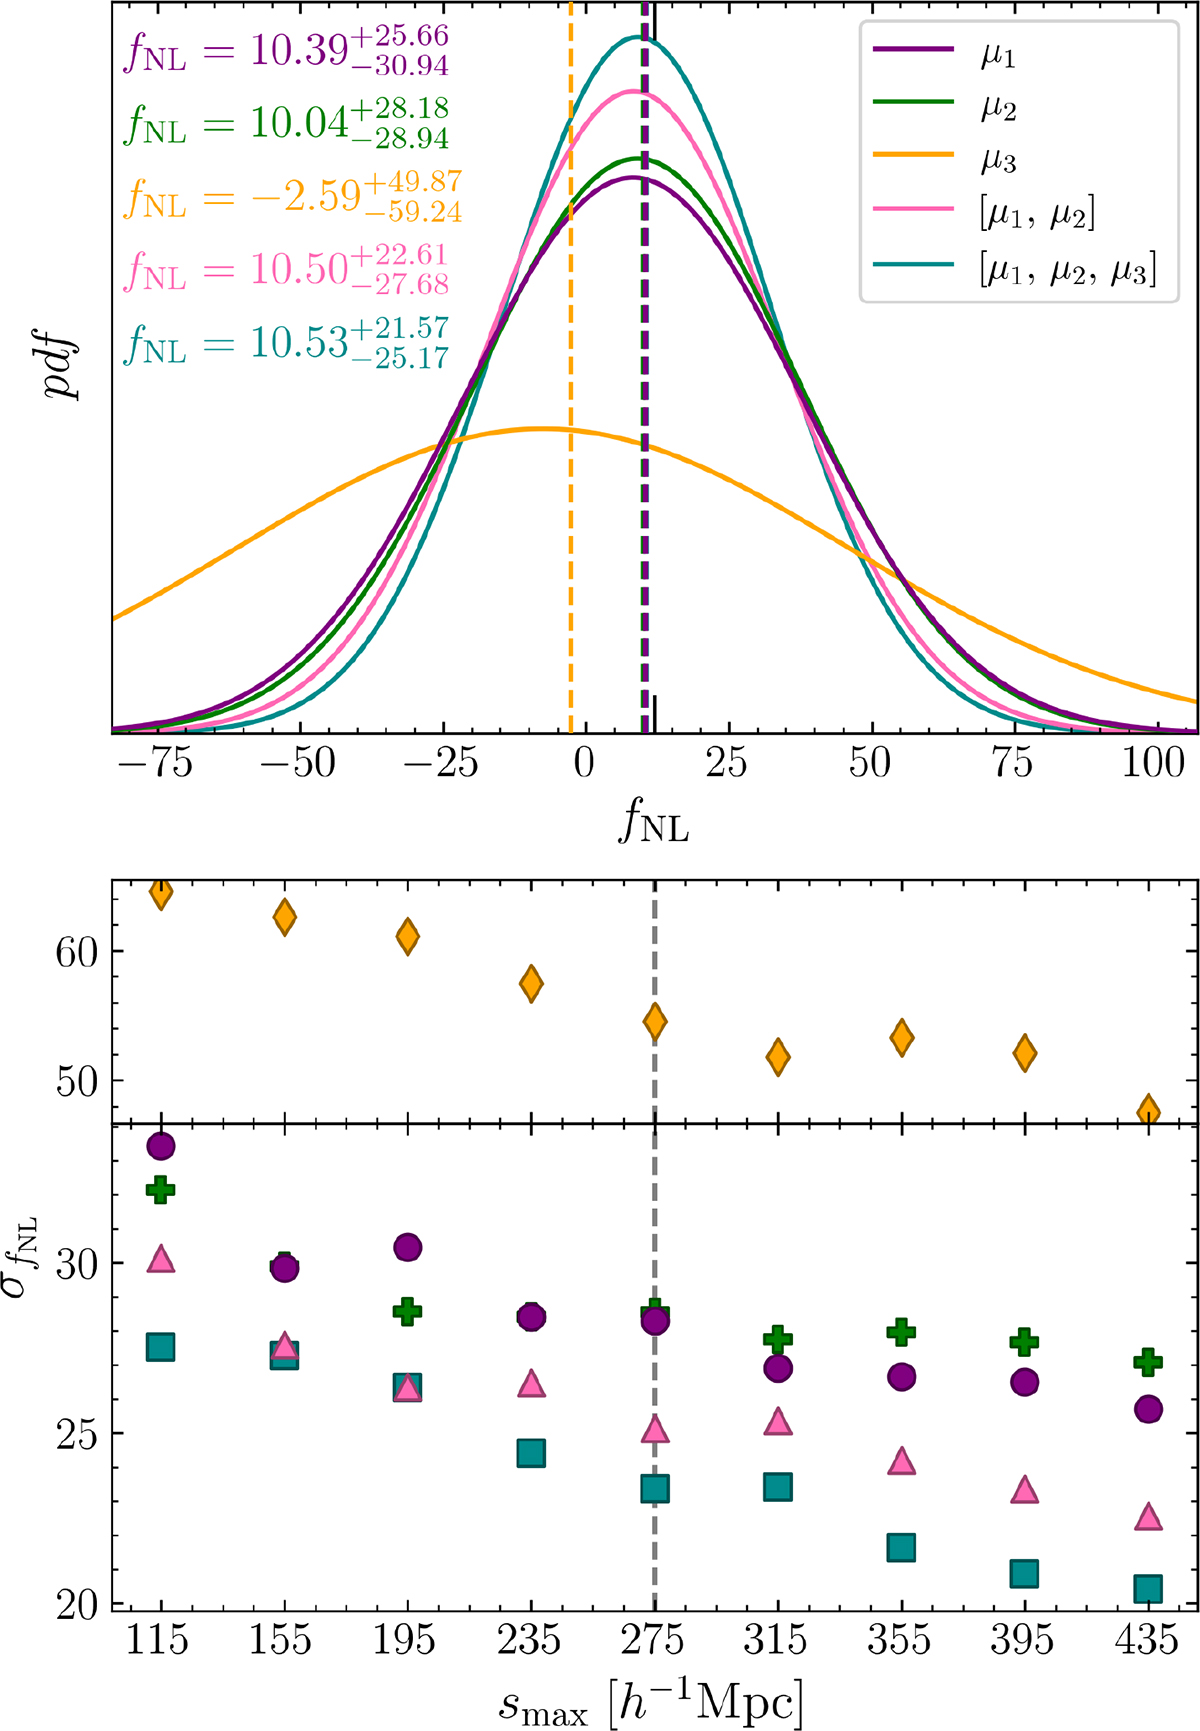
Top panel: Marginalized posterior distributions of fNL for five different observables: μ1 (purple), μ2 (green), μ3 (yellow), [μ1, μ2] (pink), and [μ1, μ2, μ3] (our full model, cyan; see Eq. (16) and Fig. 6). Each observation vector is constructed and sampled independently using the fNL = 12 test simulations. Dashed lines indicate the median value of the MCMC posterior for each case, with corresponding uncertainties (16th and 84th percentiles) annotated in the upper left. Bottom panel: 1σ uncertainty on fNL as function of maximum scale, smax, used in the observation vector. Colors correspond to those in the top panel. Each point represents an independent sampling using bins up to that smax. The dashed vertical gray line marks the smax adopted for the main analysis.
Current usage metrics show cumulative count of Article Views (full-text article views including HTML views, PDF and ePub downloads, according to the available data) and Abstracts Views on Vision4Press platform.
Data correspond to usage on the plateform after 2015. The current usage metrics is available 48-96 hours after online publication and is updated daily on week days.
Initial download of the metrics may take a while.