Fig. 3
Download original image
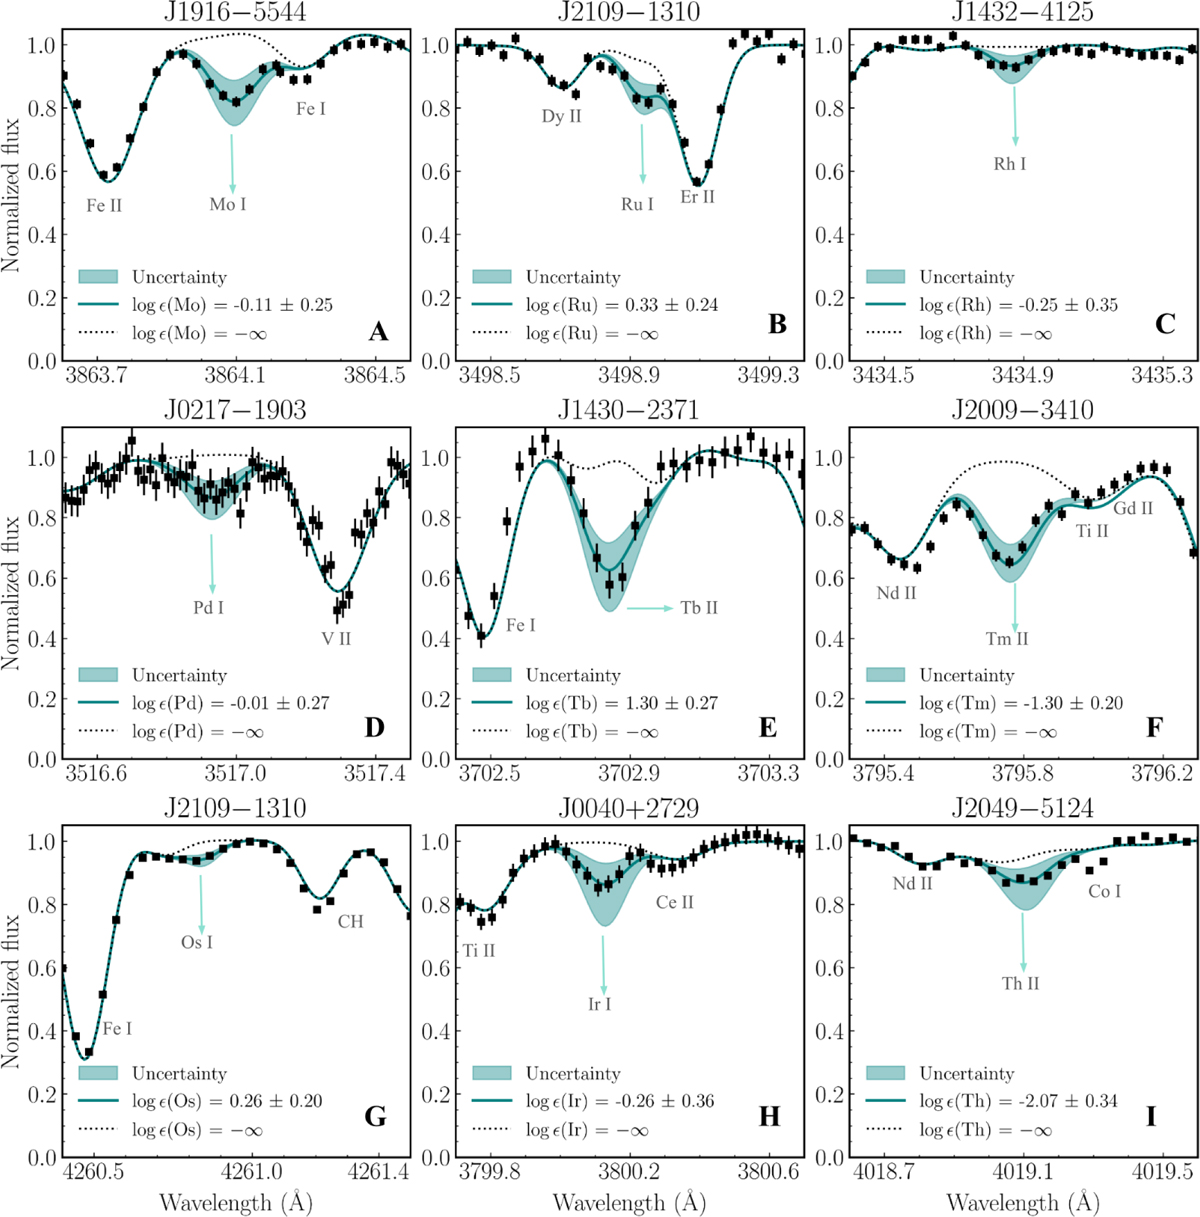
Examples of spectral synthesis fits used to derive elemental abundances. The observed data (black squares) are shown along with the best-fit synthetic spectra (solid teal lines) and associated uncertainties (shaded regions). The dotted lines correspond to synthetic spectra with no contribution from the indicated element (i.e., log ϵ = −∞).
Current usage metrics show cumulative count of Article Views (full-text article views including HTML views, PDF and ePub downloads, according to the available data) and Abstracts Views on Vision4Press platform.
Data correspond to usage on the plateform after 2015. The current usage metrics is available 48-96 hours after online publication and is updated daily on week days.
Initial download of the metrics may take a while.