Fig. 5
Download original image
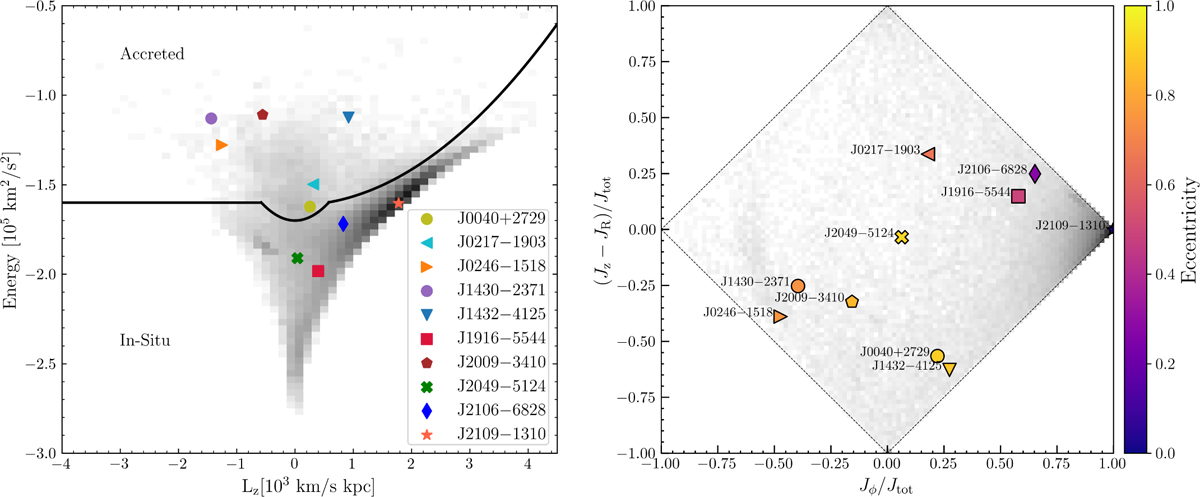
Left panel: distribution of the sample stars in the orbital energy (E) versus angular momentum (Lz) plane. The grayscale background shows GALAH DR3 stars (Buder et al. 2021) with metallicities in the range −1.3 ≤ [Fe/H] ≤ −0.9. The thick black curve marks the boundary between dynamically in situ stars (more bound, lower energy) and accreted populations (less bound, higher energy), following the prescription of Monty et al. (2024). Colored markers indicate the 10 stars in our sample, as labeled in the legend. The gray contours identify the approximate region occupied by GSE stars from Belokurov & Kravtsov (2023), adapted to our adopted potential. Right panel: action-space diagram (“diamond diagram”) showing the normalized azimuthal action (Jϕ/Jtot) on the x-axis and the normalized vertical-minus-radial action ((Jz − JR)/Jtot) on the y-axis. Colored markers correspond to the same stars as in the left panel, now color-coded by their orbital eccentricity. The grayscale background shows again the GALAH DR3 comparison sample. The gray rectangular region marks the approximate locations of the Gaia-Sausage accreted substructure, following the definitions by Myeong et al. (2019).
Current usage metrics show cumulative count of Article Views (full-text article views including HTML views, PDF and ePub downloads, according to the available data) and Abstracts Views on Vision4Press platform.
Data correspond to usage on the plateform after 2015. The current usage metrics is available 48-96 hours after online publication and is updated daily on week days.
Initial download of the metrics may take a while.