Fig. 6
Download original image
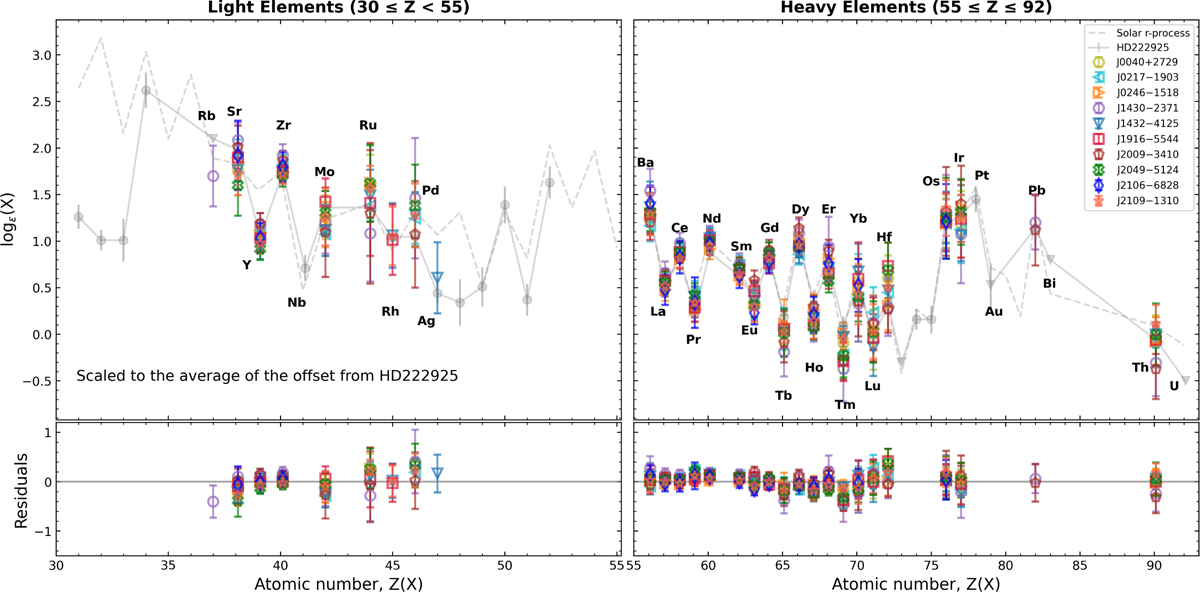
Abundance patterns of light (30 ≤ Z < 55; left panel) and heavy neutron-capture elements (55 ≤ Z ≤ 92; right panel). The colored points represent derived abundances for the ten sample stars. The abundances for each star were rescaled by subtracting the mean offset from HD 222925 (Roederer et al. 2018). The pattern of HD 222925 is represented by the solid gray line and dots; upper limits are indicated with gray downward facing triangles. The lower panel displays the residuals with respect to the reference star HD 222925. The dashed gray line is the solar r-process pattern from Sneden et al. (2008).
Current usage metrics show cumulative count of Article Views (full-text article views including HTML views, PDF and ePub downloads, according to the available data) and Abstracts Views on Vision4Press platform.
Data correspond to usage on the plateform after 2015. The current usage metrics is available 48-96 hours after online publication and is updated daily on week days.
Initial download of the metrics may take a while.