Fig. 7
Download original image
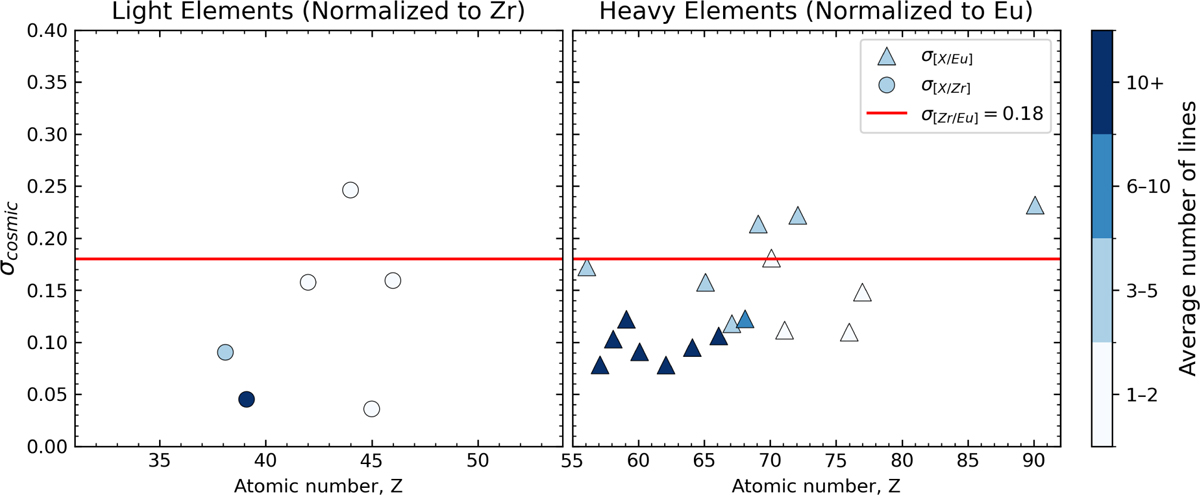
Cosmic standard deviation (σcosmic) of r-process element abundances across the stellar sample. Left: light r-process elements (normalized to Zr; shown as circles). Right: heavy r-process elements (normalized to Eu; shown as triangles). Only elements measured in at least three stars are included. Marker colors indicate the average number of spectral lines used for the abundance determination. The red horizontal line marks the standard deviation of [Zr/Eu], illustrating the overall variation between the light and heavy r-process components.
Current usage metrics show cumulative count of Article Views (full-text article views including HTML views, PDF and ePub downloads, according to the available data) and Abstracts Views on Vision4Press platform.
Data correspond to usage on the plateform after 2015. The current usage metrics is available 48-96 hours after online publication and is updated daily on week days.
Initial download of the metrics may take a while.