Open Access
Fig. C.1
Download original image
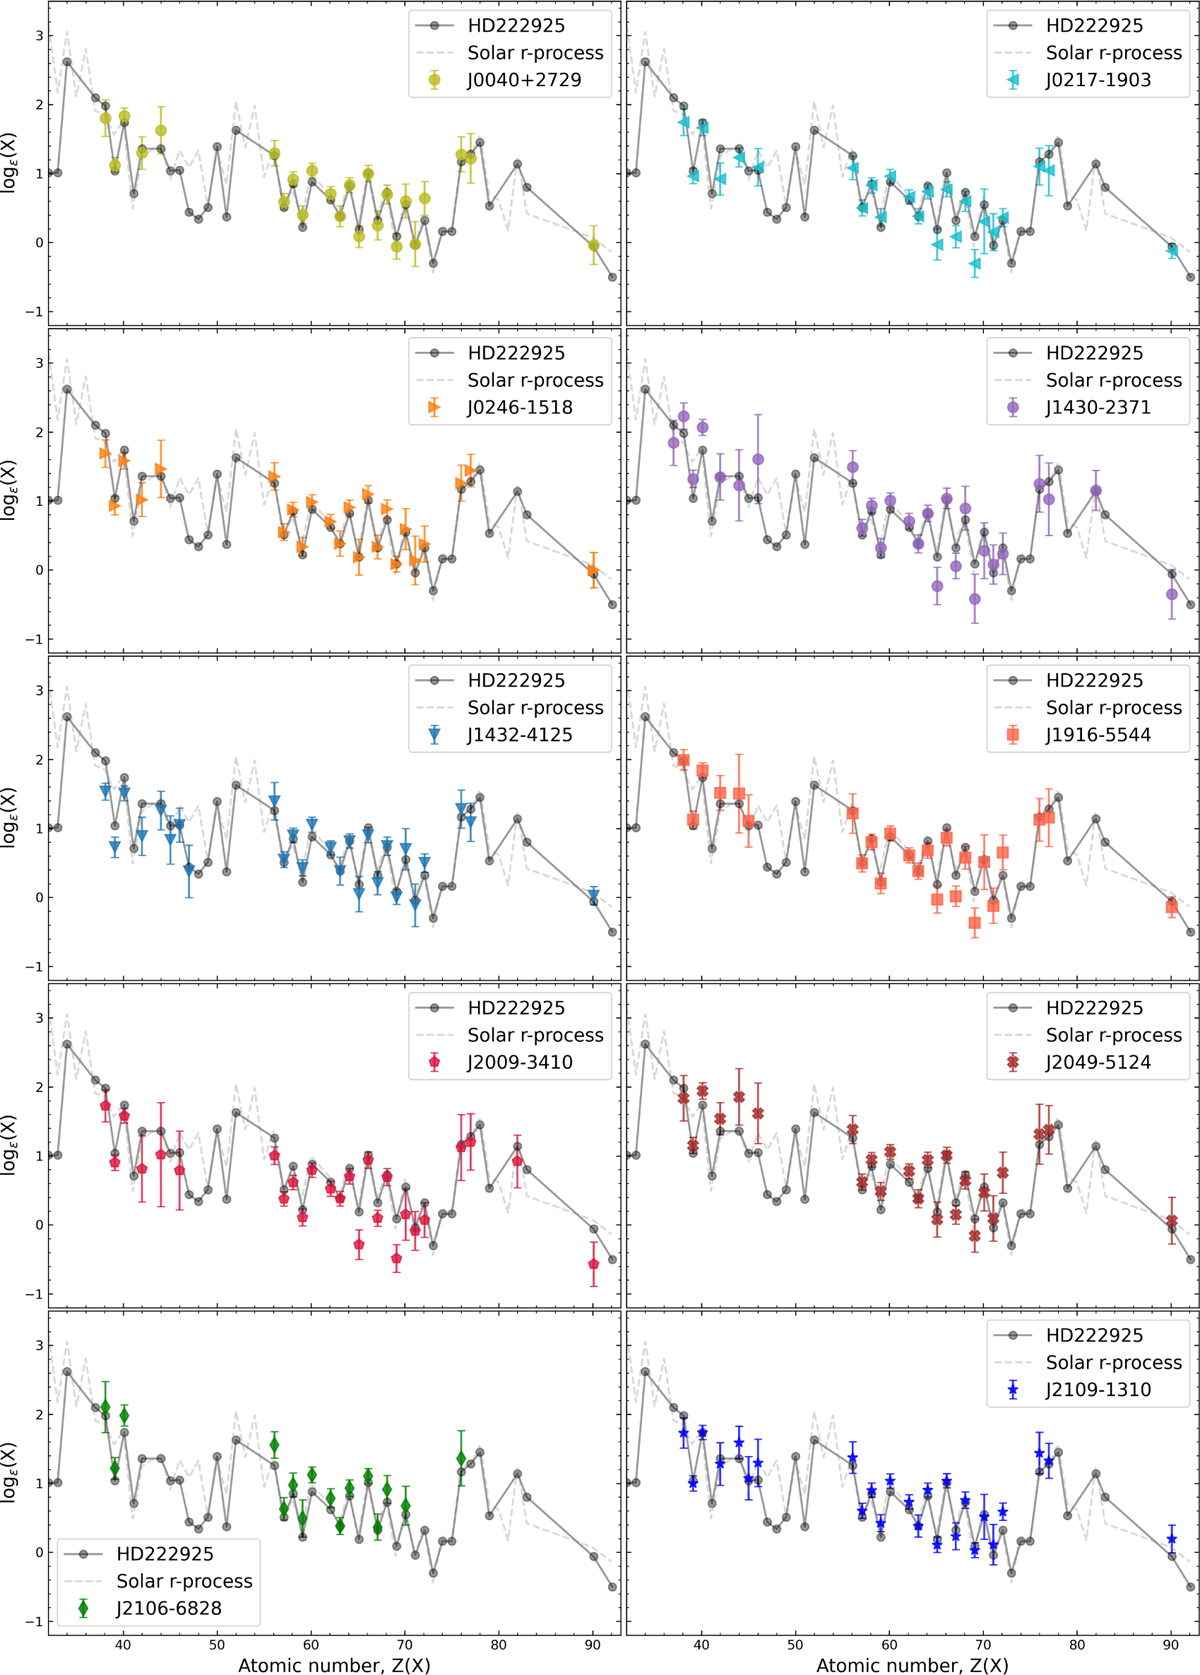
r-process patterns of the ten stars in the sample (colored markers), each rescaled to the log ϵ(Eu) value of HD 222925 (solid gray line). The dashed gray line shows the solar r-process pattern from Sneden et al. (2008).
Current usage metrics show cumulative count of Article Views (full-text article views including HTML views, PDF and ePub downloads, according to the available data) and Abstracts Views on Vision4Press platform.
Data correspond to usage on the plateform after 2015. The current usage metrics is available 48-96 hours after online publication and is updated daily on week days.
Initial download of the metrics may take a while.