Open Access
Fig. 5
Download original image
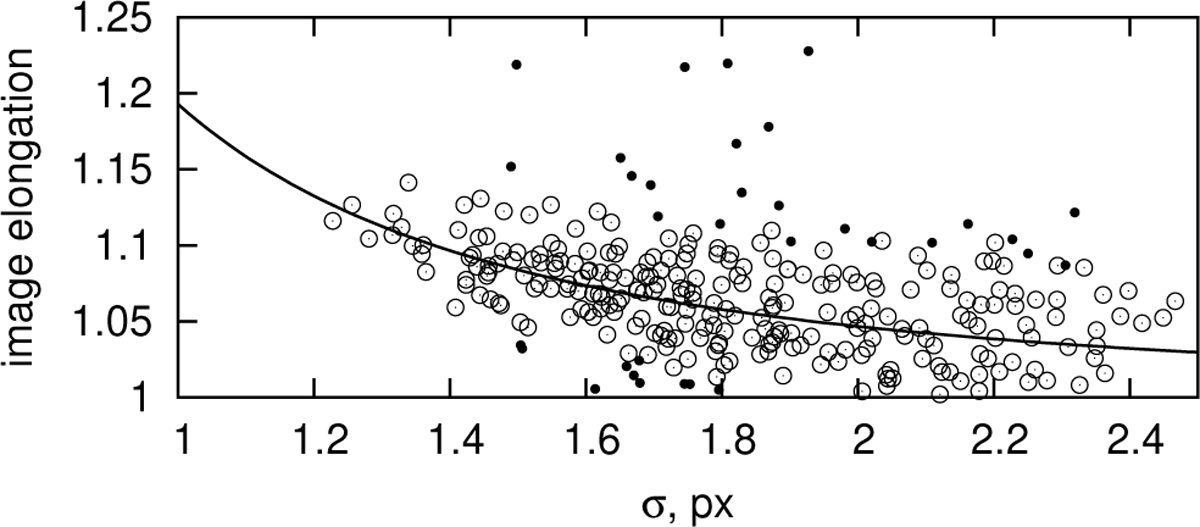
Dependence of the binary image elongation, u, shown as circles, on the size of the minor semi-axis, σ, fit function Eq. (4), shown as a solid curve, and the data rejected due to inconsistency in the reference star measurements, shown as dots.
Current usage metrics show cumulative count of Article Views (full-text article views including HTML views, PDF and ePub downloads, according to the available data) and Abstracts Views on Vision4Press platform.
Data correspond to usage on the plateform after 2015. The current usage metrics is available 48-96 hours after online publication and is updated daily on week days.
Initial download of the metrics may take a while.