Open Access
Fig. 7
Download original image
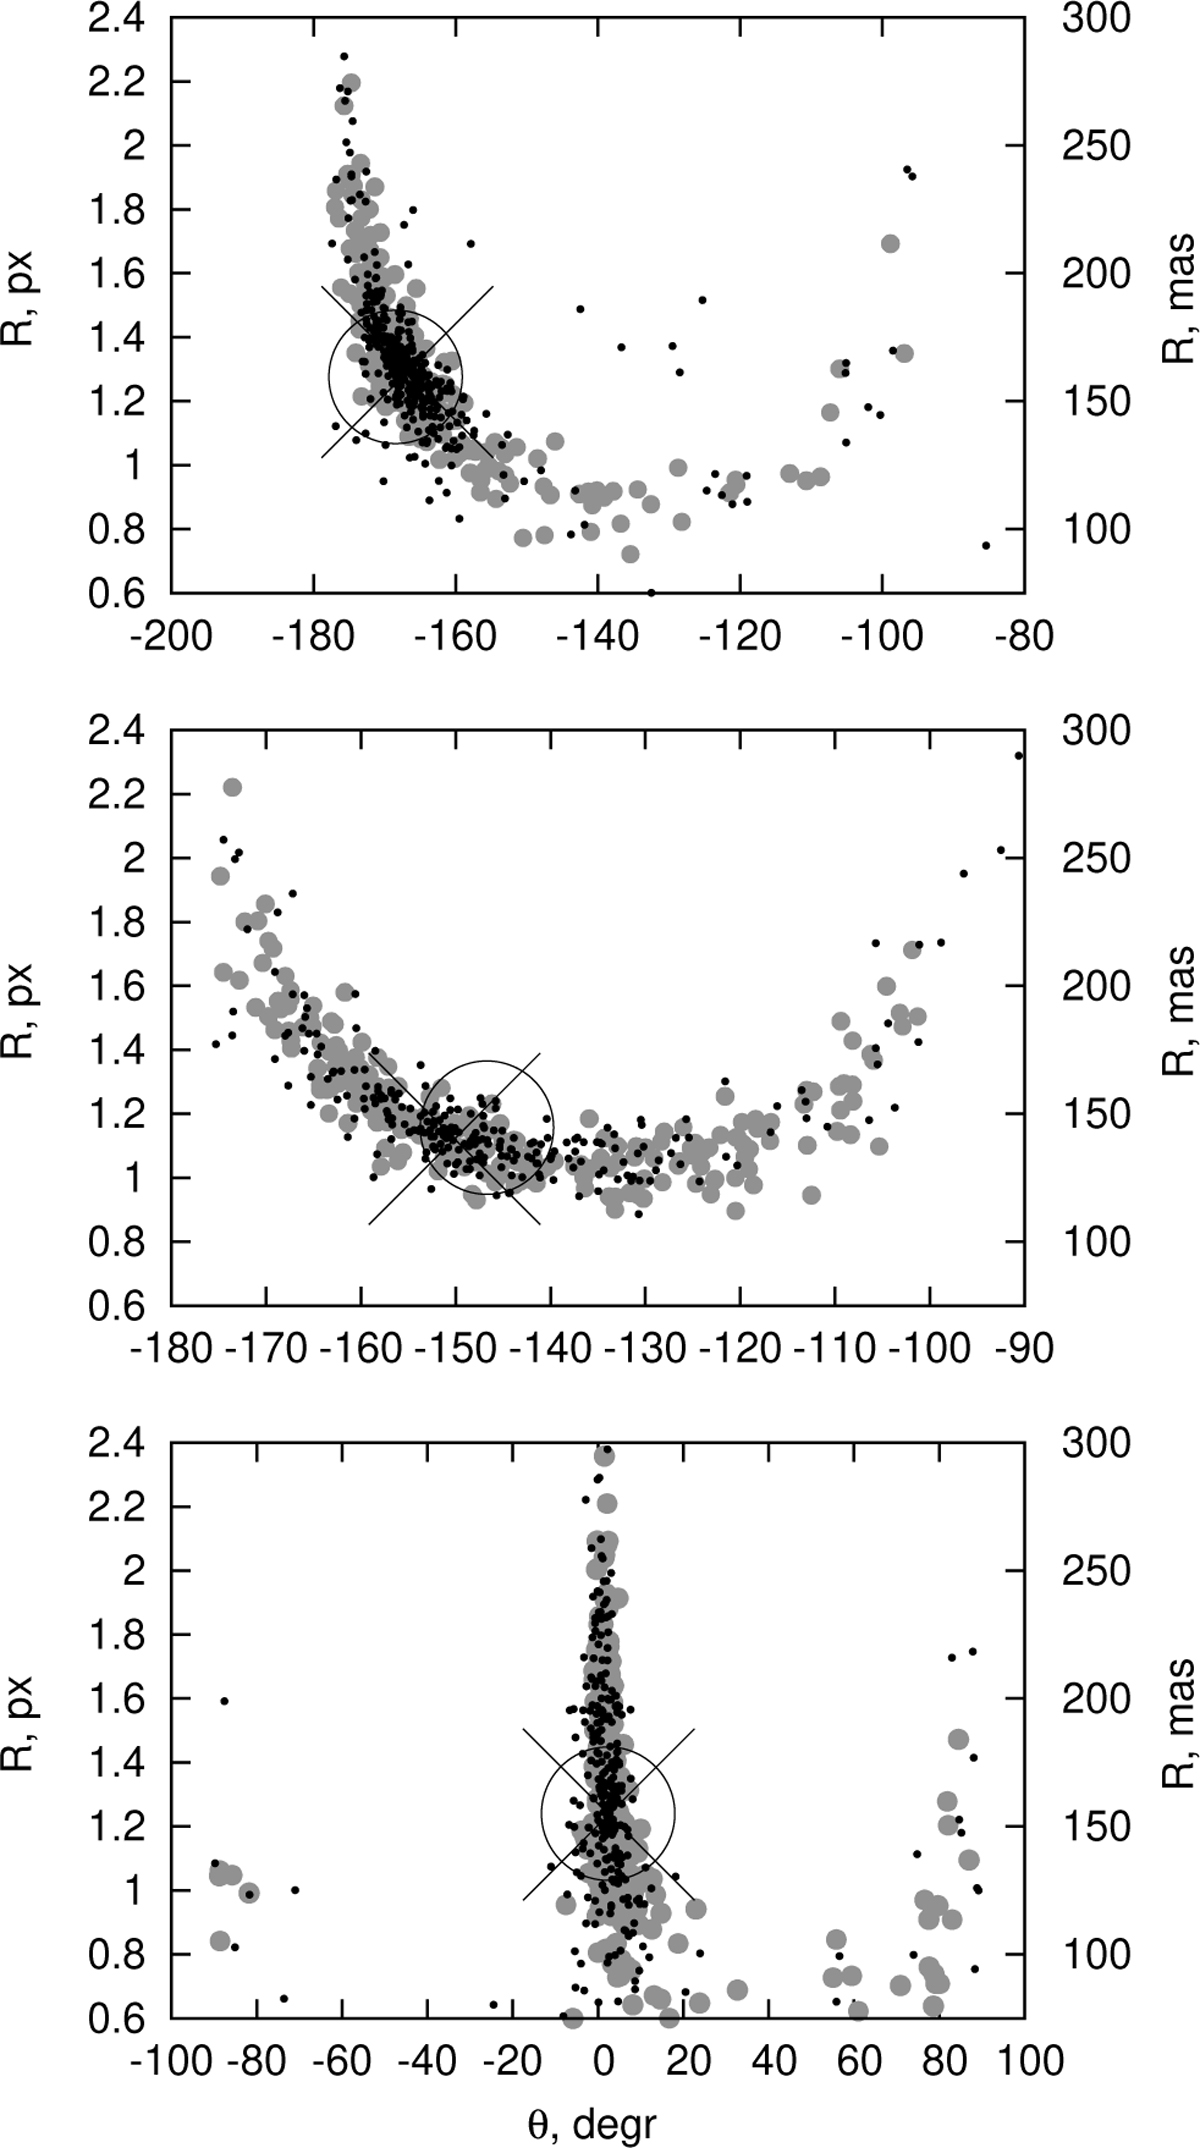
Example 2D distributions of the parameters R, θ for individual FORS2 images (black dots) and for simulated random images (pale circles) in 2011, 2012, and 2019 years (upper, middle, and lower panels respectively); the best average values R0, θ0 (crosses); and the standard weighted average of R, θ (circles).
Current usage metrics show cumulative count of Article Views (full-text article views including HTML views, PDF and ePub downloads, according to the available data) and Abstracts Views on Vision4Press platform.
Data correspond to usage on the plateform after 2015. The current usage metrics is available 48-96 hours after online publication and is updated daily on week days.
Initial download of the metrics may take a while.