Fig. 4
Download original image
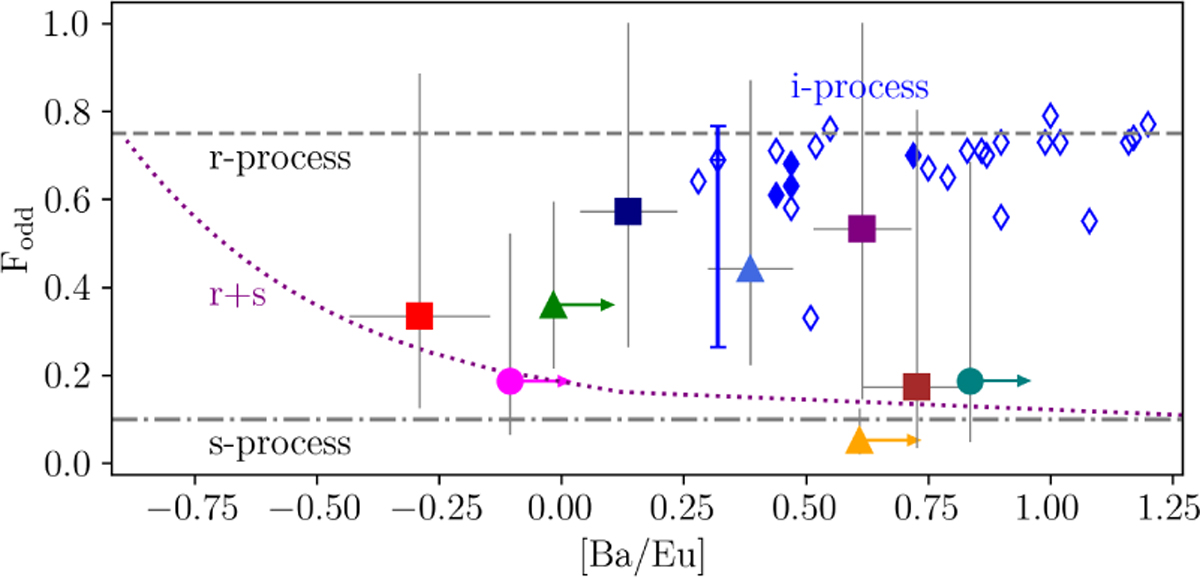
Fodd as a function of [Ba/Eu] in the sample stars. The designations are the same as in Fig. 3. For comparison, we show the theoretical predictions for r-process (dashed line), s-process (dashdotted line), s- and r-process material mixture (dotted line), and i-process (diamonds). The filled diamonds correspond to i-process models with [Fe/H] and [Ba/Fe] that fall in the parameter range of our sample stars. The blue error bar indicates i-process nuclear uncertainties associated with the 1 m⊙ model with [Fe/H] = −2.5.
Current usage metrics show cumulative count of Article Views (full-text article views including HTML views, PDF and ePub downloads, according to the available data) and Abstracts Views on Vision4Press platform.
Data correspond to usage on the plateform after 2015. The current usage metrics is available 48-96 hours after online publication and is updated daily on week days.
Initial download of the metrics may take a while.