| Issue |
A&A
Volume 704, December 2025
|
|
|---|---|---|
| Article Number | A103 | |
| Number of page(s) | 7 | |
| Section | Stellar atmospheres | |
| DOI | https://doi.org/10.1051/0004-6361/202557031 | |
| Published online | 08 December 2025 | |
Distinct barium isotope ratios in CEMP-s and CEMP-rs stars★
1
Institute of Astronomy, Russian Academy of Sciences,
Pyatnitskaya 48,
119017
Moscow,
Russia
2
INAF – Osservatorio Astrofisico di Arcetri,
Largo E. Fermi 5,
50125
Firenze,
Italy
3
Institut d’Astronomie et d’Astrophysique, Université Libre de Bruxelles,
CP 226,
1050
Brussels,
Belgium
★★ Corresponding author: This email address is being protected from spambots. You need JavaScript enabled to view it.
Received:
29
August
2025
Accepted:
16
October
2025
Abstract
Aims. We present a spectroscopic analysis of ten carbon-enhanced metal-poor (CEMP) stars of type CEMP-s and CEMP-rs and determine their non-local thermodynamic equilibrium abundances of Ba and Eu, as well as the fractions of the odd Ba isotopes (Fodd). The determination of Fodd in stars provides unambiguous information about the s-process contribution to their total Ba abundance. We aim to obtain observational constraints on the enrichment scenarios of CEMP-rs stars.
Methods. The Ba abundances inferred from the resonance Ba II 4554 and 4934 Å lines depend on the adopted Ba isotope mixture. We took different Fodd from 0.1 to 1.0 and determined the corresponding abundances from the Ba II resonance lines in each sample star. In addition, we determined the Ba abundances from the Ba II subordinate lines, which are almost independent of Fodd. We then compared the Ba abundances derived from the subordinate lines with those from the Ba II resonance lines.
Results. We found different Fodd values in CEMP-s and CEMP-rs stars. CEMP-s stars exhibit Fodd = 0.05−0.03+0.07, 0.17−0.14+0.63, 0.19−0.14+0.50, and 0.19−0.12+0.33. The obtained values agree within the error bars with the s-process Fodd = 0.10 and the solar Fodd = 0.18. Although the uncertainties are large, the possibility of a Ba isotope origin in a pure r-process with Fodd = 0.75 can be excluded for three of the four stars. CEMP-rs stars show Fodd = 0.34−0.21+0.55, 0.36−0.14+0.23, 0.44−0.22+0.43, 0.53−0.38+0.47, and 0.57−0.31+0.43, which are higher than those in CEMP-s stars. Although the uncertainties are large, in four of five stars, the possibility of a pure s-process origin for the Ba isotopes can be excluded. The obtained values agree within the error bars with the predicted i-process Fodd = 0.6 to 0.8.
Conclusions. Our analysis of CEMP-rs stars with [Ba/Eu] > 0 demonstrates that their [Ba/Eu] and Fodd cannot be jointly explained by a mixture of material produced by the r- and s-processes. The obtained results argue that the i-process causes the chemical composition of these CEMP-rs stars.
Key words: nuclear reactions, nucleosynthesis, abundances / stars: abundances / stars: atmospheres / binaries: close / stars: carbon / stars: late-type
Based on data obtained from the European Southern Observatory Science Archive and the Keck Observatory Archive.
© The Authors 2025
 Open Access article, published by EDP Sciences, under the terms of the Creative Commons Attribution License (https://creativecommons.org/licenses/by/4.0), which permits unrestricted use, distribution, and reproduction in any medium, provided the original work is properly cited.
This article is published in open access under the Subscribe to Open model. This email address is being protected from spambots. You need JavaScript enabled to view it. to support open access publication.
1 Introduction
Carbon-enhanced metal-poor (CEMP) stars have been the subject of ongoing interest for several decades. The various mechanisms leading to carbon overabundances resulted in a vast subclassification of CEMP-type stars (Beers & Christlieb 2005). In this study, we focus on CEMP-s and CEMP-rs stars, which are known to be members of binary systems (Preston & Sneden 2001; Lucatello et al. 2005), and exhibit overabundances of neutron (n-) capture elements. These stars allow us to study the properties and nucleosynthesis of their intermediate-mass asymptotic giant branch (AGB) companions, which have now become white dwarfs.
Ba and Eu traditionally serve as key diagnostic elements and are known in the literature as slow (s-) and rapid (r-) process elements, respectively. In solar material, 88% of Ba originates from the s-process, and 95% of Eu originates from the r-process (Prantzos et al. 2020). Using the above values and the solar abundances of Lodders et al. (2009), we calculated [Ba/Eu]1 = 1.25 and −0.90 for the pure s- and r-processes, respectively. In the literature, the [Ba/Eu] ratio is used to distinguish between CEMP-s and CEMP-rs stars: CEMP stars with higher [Ba/Eu] are considered CEMP-s stars, and those with lower [Ba/Eu] are considered CEMP-rs stars. The exact [Ba/Eu] abundance ratio, along with other elemental ratios such as [Ba/Fe], [Eu/Fe], and others used for classification, varies between studies (Beers & Christlieb 2005; Jonsell et al. 2006; Abate et al. 2016; Frebel 2018; Hansen et al. 2019; Karinkuzhi et al. 2021; Goswami et al. 2021). Numerous classification schemes available in the literature demonstrated that it is hard to distinguish between CEMP-rs and CEMP-s stars.
The chemical element abundances in CEMP-s stars provide observational evidence for the enrichment with elements that are produced by the main s-process in AGB companion stars, while the nature of the n-capture element overabundances in CEMP-rs is a matter of debate. Various scenarios have been proposed to explain the Eu overabundance in CEMP-rs stars along with the Ba overabundance. The first scenario implies that an r-process-enhanced star has been contaminated with s-process material from its companion star (see, for example, Hill et al. 2000; Jonsell et al. 2006; Bisterzo et al. 2011). The second scenario suggests that a star was contaminated with material produced in the intermediate (i-) n-capture process (Hampel et al. 2016). Its astrophysical site and physical conditions are not clearly understood. For example, i-process nucleosynthesis scenarios in MP asymptotic giant branch stars (Choplin et al. 2022b, 2024) or white dwarfs (Denissenkov et al. 2019) have been proposed. These scenarios are not mutually exclusive, and all of them can exist and might cause the chemical composition of different CEMP-rs stars (for more details of the formation mechanisms of CEMP-rs stars, see the discussion in Goswami et al. 2021).
To obtain observational constraints on the formation scenarios of CEMP-rs stars, accurate data on the abundances and isotope ratios in CEMP-rs stars are needed. The determination of the Ba isotope ratio in stars provides unambiguous information about the contribution of the s-process to the Ba abundance. In stars, Ba can be represented by five isotopes: 134Ba, 135Ba, 136Ba, 137Ba, and 138Ba. The isotopes 134Ba and 136Ba are s-only isotopes and cannot be produced in the r-process and i-process due to the presence of the stable r-only isotopes 134Xe and 136Xe, which block the β-decay pathway and prevent the formation of 134Ba and 136Ba. For different n-capture processes, calculations predict different fractions of odd isotopes (Fodd = (N(135Ba) + N(137Ba))/N(Ba)). For example, Fodd = 0.10 (s-process, Prantzos et al. 2020), 0.60–0.80 (i-process, Choplin et al. 2025), and 0.75 (r-process, Prantzos et al. 2020). Therefore, the ratio of odd to even isotopes allows us to distinguish stars in which Ba is mainly produced by the s-process from other stars.
The method of the Ba isotope ratio determination relies on the fact that the odd isotopes are subject to hyperfine splitting (HFS) of the energy levels, and a higher Fodd results in a broader line profile and a greater total absorbed energy. HFS primarily affects the ground state, meaning that the Ba II resonance lines can serve as a diagnostic of the Ba isotope ratio. In contrast, subordinate lines are unaffected by the adopted isotope ratio and can be used as reliable indicators of barium abundance. This feature can be used for an Fodd determination by comparing abundances from the subordinate lines and the resonance lines computed with different Fodd. This idea was first proposed by Cowley & Frey (1989), who pointed out the importance of taking HFS into account when determining Ba abundances. The abundance comparison method of the Fodd determination was applied to MP stars in the Milky Way (Mashonkina & Zhao 2006; Mashonkina et al. 2008; Mashonkina & Belyaev 2019; Sitnova et al. 2025) and in the Sculptor dwarf spheroidal galaxy (Jablonka et al. 2015). We applied this method to CEMP-s and CEMP-rs stars.
To better understand the nature of CEMP-s and CEMP-rs stars, we answer the question whether CEMP-s and CEMP-rs stars have distinct Ba isotope ratios, and we determine if the Ba isotope ratios help us to distinguish different enrichment scenarios of the CEMP-rs stars: i-process or a mixture of the r- and s-processes. Our key diagnostics for identifying n-capture element sources are the [Ba/Eu] and Ba isotope ratios.
The paper is structured as follows. In Sect. 2, we describe our sample stars and observations. We present the stellar atmosphere parameters in Sect. 3. The abundance determination method is presented in Sect. 4. We discuss our findings in Sect. 5, and we summarise our conclusions in Sect. 6.
Stellar sample, atmospheric parameters, and characteristics of the observed spectra.
2 Stellar sample and observations
For our analysis, we selected stars known in the literature as CEMP-s or CEMP-rs stars. To determine the Ba isotope ratio, we set the following criteria: (i) The resonance lines and the subordinate lines of Ba II must be detectable in high-resolution spectra that are publicly available in the ESO and Keck archives; (ii) the Ba II resonance lines must be strong enough to trace the Ba isotope ratios, and the remaining lines must not be too saturated to allow for accurate abundance measurements; and (iii) the Ba II lines must be free from blending with the carbon lines.
It is challenging to select CEMP stars that are suitable for a Ba isotope ratio analysis because the carbon and barium abundances in these stars are high. To minimise the impact of carbon line blending and Ba II lines saturation, we selected stars with high Teff and log g, that is, dwarfs and subgiants (Table 1). In Sitnova et al. (2025), we studied stars whose Ba II resonance line equivalent width (EW) was lower than 140 mÅ. Application of the same threshold to CEMP stars resulted in a very small sample of five stars, which prevented us from drawing a reasonable conclusion. To double our sample, we raised the upper limit to 180 mÅ. This threshold still allowed us to stay within a reasonable saturation range in the growth curve and not to deal with the upper atmospheric level effects (Giribaldi et al. 2025). We analyse the sensitivity of the Ba II resonance lines to the isotope ratio as a function of EWs in Sect. 4.
We selected ten stars that are listed in Table 1 alongside the characteristics of their observed spectra, stellar atmosphere parameters, and the classification from the literature. Five stars are known in the literature as CEMP-rs stars, two stars are CEMP-s stars, and for the remaining three stars, it is unclear whether they are CEMP-s or CEMP-rs stars.
We used high-resolution spectra with a high signal-to-noise ratio (S/N) that are available in the European Southern Observatory Science Archive and the Keck Observatory Archive. For six sample stars, we used data from the UV-Visual Echelle Spectrograph (UVES) at the UT2 Kueyen Telescope, and we also use dthe High Accuracy Radial Velocity Planet Searcher (HARPS) spectrograph at the La Silla 3.6 m telescope and the High-Resolution Echelle Spectrometer (HIRES) at the Keck I Telescope. The quality of the adopted spectra is reasonable, with a spectral resolution of λ/Δλ > 30 000 and a S/N per pixel of >30. The program IDs are listed in Table 1.
3 Stellar atmosphere parameters
We calculated the effective temperatures (Teff) using the Gaia BP – G, G – RP, BP – RP dereddened colours and the calibration of Mucciarelli et al. (2021). The extinction E(B – V) was adopted from Schlafly & Finkbeiner (2011), and the colours were corrected according to Casagrande & VandenBerg (2018). Different colours yield very similar effective temperatures, and the uncertainty in Teff is therefore mainly defined by an uncertainty in the calibration of 80 K, as given by Mucciarelli et al. (2021). This means that in the range of stellar parameters we studied, the molecular carbon bands at 4310 Å are too weak to affect the colours.
We calculated the surface gravities (log g) using distances based on Gaia parallaxes. The parallaxes were corrected for the zero offset according to Lindegren et al. (2021), and the distances were computed from the maximum of the probability distribution function as described in Bailer-Jones (2015). With these distances, Teffs, bolometric corrections of Casagrande & VandenBerg (2018), and assuming a mass of 0.8 solar masses, we derived the surface gravities using the formula log g = 4.44 + log(m/m⊙) + 0.4(Mbol – 4.75) + 4 log(Teff/5780), where m⊙ is the solar mass, and Mbol is the absolute bolometric magnitude.
The microturbulent velocity was computed using an empirical relation based on a non-local thermodynamic equilibrium (NLTE) analysis of Fe I and Fe II lines in dwarfs (Sitnova et al. 2015) and of Fe I, Fe II, and Ti II lines in giants (Sitnova et al. 2025). We estimated the metallicity using LTE abundances from the strongest lines of Fe II 4923 Å and 5018 Å. Since our sample stars are mostly hot dwarfs, many of them have no other Fe II lines but these two. For the Fe II at 4923 Å and 5018 Å lines, we adopted the oscillator strengths log gf = −1.39 and −1.23, respectively, from Raassen & Uylings (1998), which were corrected by +0.11 dex following the recommendation of Grevesse & Sauval (1999). The NLTE effects for the Fe II lines are negligible in the stellar parameter range we considered (Mashonkina et al. 2011, 2019).
4 Abundance analysis
4.1 Codes and model atmospheres
We used classical 1D model atmospheres from the MARCS model grid (Gustafsson et al. 2008), interpolated for the given Teff, log g, and [Fe/H] of the stars. We studied carbon-enhanced stars that are products of mass transfer in a binary system. To make sure if using model atmospheres with a standard chemical composition is reasonable for CEMP stars, we computed two model atmospheres for one sample star, HD 196944, with different abundances of the chemical elements. These calculations were performed with the code LLMODELS (Shulyak et al. 2004), which self-consistently accounts for individual elemental abundances in the opacity calculation. For one model, we used a standard chemical composition, and another model accounted for a high carbon abundance [C/Fe] = 1.2 and modified hydrogen and helium abundances adopted as N(H)/Ntot = 0.919 and log ε(He) = −1.10, in accordance with predictions for a 2 m⊙ AGB star (Cristallo et al. 2015) and the dilution factor of 0.8 (Choplin et al. 2022a). The spectral lines we investigated were similar in the synthetic spectra computed with the two model atmospheres. A minor difference was detected in the Balmer line profiles because their hydrogen abundance is distinct.
We solved the coupled radiative transfer and statistical equilibrium equations using our version of the code DETAIL (Giddings 1981; Butler 1984), which incorporates the updated opacity package presented by Mashonkina et al. (2011). To calculate the synthetic spectra, we used the code SYNTHV_NLTE (Tsymbal et al. 2019), which is attached to the code IDL BINMAG (Kochukhov 2018). This method allowed us to obtain the best fit to the observed line profiles while accounting for the NLTE effects via pre-calculated departure coefficients (the ratio of the NLTE and LTE atomic level populations) for a given model atmosphere. When we fitted the line profiles, the abundance of the element of interest was varied alongside the macroturbulent velocity and the radial velocity.
The spectral synthesis line list was extracted from a recent version of the Vienna Atomic Line Database (VALD, Pakhomov et al. 2019; Ryabchikova et al. 2015), which provides isotopic and hyperfine structure components for a number of the chemical elements we studied. The oscillator strengths for Ba II were taken from Miles & Wiese (1969), and those for Eu II were taken from Lawler et al. (2001).
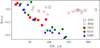 |
Fig. 1 NLTE abundance corrections for the Ba II lines as a function of EWs. See the legend for the line designations. |
4.2 Ba abundances
We analysed five lines of Ba II: the strong resonance lines at λ = 4554 Å and 4934 Å, and the subordinate lines at λ = 5853 Å, 6141 Å, and 6496 Å. In the vicinity of the Ba II 4934.0 Å line and 6141.71 Å lines lie iron lines, namely, Fe I 4934.0 Å with a lower-level energy of Eexc = 4.15 eV and an oscillator strength of log gf = −0.58, and Fe I 6141.73 Å with Eexc = 3.60 eV and log gf = −1.46. In both cases, the blending with the Fe I lines in our sample stars is negligible because their Teffs are too high to produce a significant absorption from these Fe I lines.
To account for departures from LTE, we adopted the Ba II model atom from Mashonkina & Belyaev (2019). For the resonance lines, the NLTE effects are moderate, leading to either weaker or stronger lines compared to LTE, depending on the line strength and stellar atmosphere parameters. In our sample stars, the NLTE abundance corrections for the resonance lines do not exceed 0.1 dex in absolute value (Fig. 1). For the subordinate lines, the NLTE abundance corrections are mostly negative and increase in absolute value. They reach −0.45 dex with increasing EWs to 150 mÅ.
In our spectral synthesis calculations, we considered five Ba isotopes: 134Ba, 135Ba, 136Ba, 137Ba, and 138Ba. We determined the Ba abundances using different Fodd: 0.10 (pure s-process), 0.18 (solar), 0.43, 0.62, 0.75 (pure r-process), and 1. For each sample star, we provide abundances from individual spectral lines together with their measured EWs (Table 2).
Figure 2 illustrates the sensitivity of the Ba II resonance lines with different EWs to the adopted Fodd. The impact of Fodd on the Ba abundance increases with increasing EW, and the maximum difference in the NLTE abundances computed with Fodd = 0.10 (s-process) and 0.75 (r-process) of ΔBa(r-s) = 0.4–0.5 dex is observed in stars with Ba II EWs of 100–140 mÅ. A further increase in the EWs goes with the line saturation, and stronger lines are less affected by the adopted Fodd. The saturation effect becomes more pronounced for the Ba II 4554 Å line, which has a higher gf-value than the Ba II 4934 Å line. For example, in BPS BS 16080-175, the ΔBa(r-s) amounts to 0.08 and 0.17 dex for the Ba II 4554 Å with EW = 219 mÅ and 4934 Å with EW = 184 mÅ, respectively. The former value is too low to determine Fodd, and, moreover, saturated lines provide a less reliable abundance, regardless of the adopted Fodd. The sensitivity of the resonance lines depends on the EW and also on the stellar parameters, and it might therefore be difficult to select a specific maximum EW. For our analysis, we selected the lines with a significant difference of more than 0.15 dex in the abundances computed with the s-process and the r-process Fodd. This abundance sensitivity threshold nearly corresponds to EW of 180 mÅ (Fig. 2).
NLTE and LTE abundances and EWs (mÅ) of the Ba II lines in the sample stars.
4.3 Eu abundances
Our Eu abundance determination mainly relied on the Eu II 4129 Å and 4205 Å lines. To determine the Eu abundance in BD −01 2582 and 2MASS J09124370+0216236, we had to use the Eu II 3819 Å line because the Eu II 4129 Å and 4205 Å lines are not covered with the available spectrum of BD −01 2582 or are too weak to be measured in the spectrum of 2MASS J09124370+0216236. The Eu II 3819 Å line is difficult to analyse because it is located in the blue wing of a strong Fe I 3819.62 Å line, and the S/N in the blue wavelength range is lower. This causes an uncertainty in the continuum placement and in the derived abundance. The NLTE calculations for Eu were performed with the Eu II model atom of Mashonkina & Gehren (2000). The NLTE abundance corrections for Eu II lines are available in the INASAN database2 (Mashonkina et al. 2023). In the observed spectra of half of the sample stars, no detectable lines of Eu II were found, and we estimated upper limits on their Eu abundances. Our measurements for individual lines are given in Table 3.
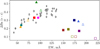 |
Fig. 2 Differences between NLTE abundances from individual lines computed with Fodd = 0.10 (s-process) and 0.75 (r-process) in the sample stars known in the literature as CEMP-s (circles) and CEMP-rs (squares), and in stars with an unclear classification (triangles). For comparison, we show data for normal VMP stars from Sitnova et al. (2025, diamonds). The open and filled symbols correspond to the Ba II 4554 Å and 4934 Å lines, respectively. |
NLTE and LTE abundances and EWs (mÅ) of the Eu II lines in the sample stars.
Impact of the uncertainties in the stellar parameters on the abundances from different lines.
4.4 Abundance uncertainties
We calculated the uncertainties in the abundance ratios including the uncertainties in the stellar atmosphere parameters and observed spectra, as well as the dispersion of the individual line measurements around the mean ![Mathematical equation: $\[\sigma_{\text {st }}= \sqrt{\Sigma\left(\log \varepsilon-\log \varepsilon_{i}\right)^{2} /(N-1)}\]$](/articles/aa/full_html/2025/12/aa57031-25/aa57031-25-eq10.png) , where N is the total number of lines. In different sample stars, the S/N of their spectra varied from 32 to 266 (Table 1), and we estimated the error caused by continuum placement for each sample star. This value is negligible in spectra with S/N > 200, but reaches 0.13 dex in the spectrum of HE 0450-4902 with the lowest S/N of 32. For the model atmosphere with Teff/log g/[Fe/H]/ξt = 6140 K/4.38/−1.9/1.2 km s−1, we estimated the abundance shifts from different lines caused by variations in Teff and ξt of 80 K and 0.1 km s−1 (Table 4).
, where N is the total number of lines. In different sample stars, the S/N of their spectra varied from 32 to 266 (Table 1), and we estimated the error caused by continuum placement for each sample star. This value is negligible in spectra with S/N > 200, but reaches 0.13 dex in the spectrum of HE 0450-4902 with the lowest S/N of 32. For the model atmosphere with Teff/log g/[Fe/H]/ξt = 6140 K/4.38/−1.9/1.2 km s−1, we estimated the abundance shifts from different lines caused by variations in Teff and ξt of 80 K and 0.1 km s−1 (Table 4).
In our Fe, Ba, and Eu abundance determination, we assumed that the dispersion and systematic errors caused by the variations in the stellar parameters and observations are uncorrelated. This assumption is justified because the spectral lines of each of the elements belong to the same species, have nearly the same intensity, and originate from atomic levels with a similar or identical Eexc. Therefore, changes in Teff, log g, and ξt do not contribute to the line-to-line scatter, which allowed us to calculate the uncertainty on the total abundance ratio [X/H] as ![Mathematical equation: $\[\sigma_{[\mathrm{X} / \mathrm{H}]}^{2}=\sigma_{\mathrm{st}}^{2}(X)+\sigma^{2}\left(T_{\mathrm{eff}}\right)+\sigma^{2}(\log g)+\sigma^{2}\left(\xi_{\mathrm{t}}\right)+\sigma_{\text {obs }}^{2}\]$](/articles/aa/full_html/2025/12/aa57031-25/aa57031-25-eq11.png) .
.
When we computed the abundance ratios [X/Y], where X and Y are Fe, Ba, and Eu, the uncertainties caused by changes in Teff, log g, and ξt were lower than those for the absolute abundances because the changes in the parameters affect the Fe II, Ba II, and Eu II spectral lines in the same way. For the abundance ratios X and Y, we calculated the uncertainty in their ratio as ![Mathematical equation: $\[\sigma_{[\mathrm{X} / \mathrm{Y}]}^{2}=\sigma_{\mathrm{st}}^{2}(X)+\sigma_{\mathrm{st}}^{2}(Y)+\sigma^{2}\left(\Delta T_{\mathrm{eff}}\right)+\sigma^{2}(\Delta \log g)+\sigma^{2}\left(\Delta \xi_{\mathrm{t}}\right)+ \sigma_{\text {obs }}^{2}\]$](/articles/aa/full_html/2025/12/aa57031-25/aa57031-25-eq12.png) .
.
This also holds for the uncertainty in the difference between the NLTE abundances from the subordinate and the resonance Ba II lines ΔBa(sub.-res.). For illustration, we determined Fodd in HD 196944 using an additional set of stellar parameters Teff/log g/[Fe/H]/ξt = 5539 K/2.44/−2.50 from Giribaldi et al. (2023). In our test calculations, we found Fodd = ![Mathematical equation: $\[0.64_{-0.32}^{+0.36}\]$](/articles/aa/full_html/2025/12/aa57031-25/aa57031-25-eq13.png) , which is consistent within the error bars with Fodd =
, which is consistent within the error bars with Fodd = ![Mathematical equation: $\[0.44_{-0.22}^{+0.43}\]$](/articles/aa/full_html/2025/12/aa57031-25/aa57031-25-eq14.png) determined based on the stellar parameters from this study. The two sets of stellar parameters yield a similar [Ba/Fe] = 0.37 and 0.39 for the parameters of Giribaldi et al. (2023) and ours, respectively.
determined based on the stellar parameters from this study. The two sets of stellar parameters yield a similar [Ba/Fe] = 0.37 and 0.39 for the parameters of Giribaldi et al. (2023) and ours, respectively.
 |
Fig. 3 Differences between NLTE abundances from the subordinate and the resonance Ba II lines computed with Fodd = 0.10 (s-process, filled symbols) and 0.75 (r-process, open symbols) in the sample stars known in the literature as CEMP-s (circles) and CEMP-rs (squares), and in stars with an unclear classification (triangles). |
4.5 Fractions of odd Ba isotopes
Figure 3 shows ΔBa(sub.-res.) computed with Fodd = 0.10 (sprocess) and 0.75 (r-process) in the sample stars. Using the ΔBa(sub.-res.) computed for different Fodd from 0.1 to 1.0, we estimated Fodd that ensures equal NLTE abundances from the subordinate and resonance lines ΔBa(sub.-res.) = 0. The errors in Fodd were inferred from the errors in ΔBa(sub.-res.), namely the maximum and the minimum Fodd ensure ΔBa(sub.-res.) = ± σΔBa(sub.–res.).
Table 5 presents the derived abundance ratios and fractions of odd Ba isotopes together with their uncertainties. We took the solar abundances from Lodders (2021): log ε(Fe)⊙ = 7.45, log ε(Ba)⊙ = 2.17, and log ε(Eu)⊙ = 0.51.
NLTE abundance ratios and fractions of odd Ba isotopes in the sample stars.
5 Discussion
5.1 Fodd in different sample stars
In three sample stars, we found NLTE abundances from the subordinate and the resonance lines that were consistent within the error bars when we assumed the s-process Fodd, while the r-process value resulted in an abundance discrepancy that was larger than the error bars. Two of these stars, HE 1029-0546 and HE 0450-4902, are known in the literature as CEMP-s (Hansen et al. 2015). Our Ba isotope analysis results in Fodd = ![Mathematical equation: $\[0.19_{-0.14}^{+0.50}\]$](/articles/aa/full_html/2025/12/aa57031-25/aa57031-25-eq24.png) and
and ![Mathematical equation: $\[0.19_{-0.12}^{+0.33}\]$](/articles/aa/full_html/2025/12/aa57031-25/aa57031-25-eq25.png) , which is close to the solar value Fodd = 0.18, and it thus confirms that the barium in these stars mainly originated from the s-process. For the third star, 2MASS J11140709+1828320, Spite et al. (2013) were unable to identify whether it is a CEMP-s or CEMP-rs star, as it lacks Eu lines. Our analysis revealed that 2MASS J11140709+1828320 is a CEMP-s star with [Ba/Eu] > 0.6 and the lowest Fodd =
, which is close to the solar value Fodd = 0.18, and it thus confirms that the barium in these stars mainly originated from the s-process. For the third star, 2MASS J11140709+1828320, Spite et al. (2013) were unable to identify whether it is a CEMP-s or CEMP-rs star, as it lacks Eu lines. Our analysis revealed that 2MASS J11140709+1828320 is a CEMP-s star with [Ba/Eu] > 0.6 and the lowest Fodd = ![Mathematical equation: $\[0.05_{-0.03}^{+0.07}\]$](/articles/aa/full_html/2025/12/aa57031-25/aa57031-25-eq26.png) of our sample stars. Hereafter, we refer to these three stars as CEMP-s stars.
of our sample stars. Hereafter, we refer to these three stars as CEMP-s stars.
For the other five sample stars, the s-process Fodd resulted in lower abundances from the subordinate lines compared to the resonance lines, and this cannot be explained by errors in the abundance determination method. In contrast to the s-process Fodd, using the r-process Fodd yielded consistent within the error bars with the NLTE abundances from the subordinate and the resonance lines in these stars. An exception was BPS CS 310620-12, where we failed to estimate Fodd, as the maximum Fodd = 1 provides ΔBa(sub.-res.) = −0.13 dex. This discrepancy is significantly smaller than that of −0.34 dex derived in BPS CS 310620-12 for the s-process Fodd. Based on the above information and its [Ba/Eu] = 0.22, we consider this star to be a CEMP-rs star, in agreement with its literature classification (Abate et al. 2015). In total, four of these five stars are known as CEMP-rs stars, and the remaining star HD 196944 has an unclear classification. For HD 196944, we found [Ba/Eu] = 0.39 and Fodd = ![Mathematical equation: $\[0.44_{-0.22}^{+0.43}\]$](/articles/aa/full_html/2025/12/aa57031-25/aa57031-25-eq27.png) and classified it as a CEMP-rs star. Hereafter, we refer to these five stars as CEMP-rs stars. The CEMP-rs sample stars exhibit [Ba/Eu] from −0.3 to 0.6, which is lower than for the CEMP-s sample stars, which have lower limits on [Ba/Eu] > 0.8, > 0.6, and > −0.1.
and classified it as a CEMP-rs star. Hereafter, we refer to these five stars as CEMP-rs stars. The CEMP-rs sample stars exhibit [Ba/Eu] from −0.3 to 0.6, which is lower than for the CEMP-s sample stars, which have lower limits on [Ba/Eu] > 0.8, > 0.6, and > −0.1.
BPS CS 22881-036 is known in the literature as CEMP-rs (Abate et al. 2015). For this star with Fodd = ![Mathematical equation: $\[0.17_{-0.14}^{+0.63}\]$](/articles/aa/full_html/2025/12/aa57031-25/aa57031-25-eq28.png) and [Ba/Eu] = 0.73, we found that s- and r-process Fodd both yield abundances that are consistent within the error bars from the subordinate and the resonance lines. The high [Ba/Eu] and close to solar Fodd in BPS CS 22881-036 agree well with the values found in our CEMP-s sample stars. In 2MASS J11432342+2020582 neither s- nor r-process Fodd are suitable for achieving abundance consistency. For this star, we found Fodd =
and [Ba/Eu] = 0.73, we found that s- and r-process Fodd both yield abundances that are consistent within the error bars from the subordinate and the resonance lines. The high [Ba/Eu] and close to solar Fodd in BPS CS 22881-036 agree well with the values found in our CEMP-s sample stars. In 2MASS J11432342+2020582 neither s- nor r-process Fodd are suitable for achieving abundance consistency. For this star, we found Fodd = ![Mathematical equation: $\[0.36_{-0.14}^{+0.23}\]$](/articles/aa/full_html/2025/12/aa57031-25/aa57031-25-eq29.png) and [Ba/Eu] > 0. Spite et al. (2013) were unable to identify whether it is a CEMP-s or CEMP-rs star, as it lacks Eu lines. Its Fodd = 0.36 agrees well with those from 0.34 to 0.57 found in the CEMP-rs sample stars.
and [Ba/Eu] > 0. Spite et al. (2013) were unable to identify whether it is a CEMP-s or CEMP-rs star, as it lacks Eu lines. Its Fodd = 0.36 agrees well with those from 0.34 to 0.57 found in the CEMP-rs sample stars.
When we plotted ΔBa(sub.-res.) as a function of [Ba/Fe] (Fig. 3, bottom panel), we found that stars with a lower contribution of odd Ba isotopes to their Ba abundance have [Ba/Fe] of 1.5, while stars with a higher contribution of odd Ba isotopes have [Ba/Fe] of either < 1.0 or > 1.8. This finding agrees well with that of Masseron et al. (2010, see their Fig. 20), although the reason for this phenomenon remains unclear.
5.2 CEMP-rs stars: r+s processes or i-process
In pure r-process material, Fodd = 0.75 and [Ba/Eu] = −0.90, while in pure s-process material, Fodd = 0.10 and [Ba/Eu] = 1.25 (Prantzos et al. 2020). Mixing them in different proportions results in a fixed relation between Fodd and [Ba/Eu], and a higher [Ba/Eu] corresponds to a lower Fodd.
Figure 4 shows Fodd as a function of [Ba/Eu] in the sample stars, alongside with a curve that corresponds to a mixture of the s- and r-process material. We also indicate the r- and s-process predictions for Fodd taken from Prantzos et al. (2020) and the i-process predictions of Choplin et al. (2025).
The i-process predictions correspond to individual AGB models with initial masses from 1 to 3 m⊙ and [Fe/H] from −3 to −1 (for details, see Choplin et al. 2025).
Three CEMP-rs sample stars show a different Fodd and [Ba/Eu] compared to those from the s- and r-process mixture: their high Fodd values of 0.44–0.57 do not match their high [Ba/Eu] of 0.14–0.62. For comparison, equal r- and s-process material fractions yield Fodd = 0.43 and [Ba/Eu] = −0.60. Therefore, a mixing of s- and r-process material cannot explain the observed Fodd and [Ba/Eu] in these CEMP-rs stars. We consider HD 196944, BPS BS 16080–175, and BD–01 2582 as the strongest candidates thus far for encrypted i-process traces in their atmospheres.
The typical Fodd predicted for the i-process is 0.6–0.8 (Choplin et al. 2025), although the nuclear uncertainties are large, and, for example, an AGB model with [Fe/H] = −2.5 and a mass of 1 m⊙ yields Fodd = ![Mathematical equation: $\[0.69_{-0.42}^{+0.07}\]$](/articles/aa/full_html/2025/12/aa57031-25/aa57031-25-eq30.png) (Choplin et al. 2025). For six sample stars, we found their Fodd to be consistent within the error bars with the Fodd = 0.6–0.8 predicted by the i-process. When we accounted for the nuclear uncertainties, almost all our sample stars can be explained with the i-process. An exception is 2MASS J11140709+1828320 with Fodd =
(Choplin et al. 2025). For six sample stars, we found their Fodd to be consistent within the error bars with the Fodd = 0.6–0.8 predicted by the i-process. When we accounted for the nuclear uncertainties, almost all our sample stars can be explained with the i-process. An exception is 2MASS J11140709+1828320 with Fodd = ![Mathematical equation: $\[0.05_{-0.03}^{+0.07}\]$](/articles/aa/full_html/2025/12/aa57031-25/aa57031-25-eq31.png) , which clearly indicates its s-process origin.
, which clearly indicates its s-process origin.
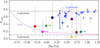 |
Fig. 4 Fodd as a function of [Ba/Eu] in the sample stars. The designations are the same as in Fig. 3. For comparison, we show the theoretical predictions for r-process (dashed line), s-process (dashdotted line), s- and r-process material mixture (dotted line), and i-process (diamonds). The filled diamonds correspond to i-process models with [Fe/H] and [Ba/Fe] that fall in the parameter range of our sample stars. The blue error bar indicates i-process nuclear uncertainties associated with the 1 m⊙ model with [Fe/H] = −2.5. |
6 Conclusions
We presented a spectroscopic analysis of ten CEMP stars and determined their Ba and Eu NLTE abundances, as well as the fractions of odd Ba isotopes. For the Ba isotope ratio analysis, we used a method based on abundance comparisons from the resonance and subordinate lines of Ba II. Our findings for the sample stars are summarised below.
We found different Fodd in CEMP-s and CEMP-rs stars.
CEMP-s stars exhibit Fodd =
![Mathematical equation: $\[0.05_{-0.03}^{+0.07}\]$](/articles/aa/full_html/2025/12/aa57031-25/aa57031-25-eq32.png) ,
, ![Mathematical equation: $\[0.17_{-0.14}^{+0.63}\]$](/articles/aa/full_html/2025/12/aa57031-25/aa57031-25-eq33.png) ,
, ![Mathematical equation: $\[0.19_{-0.14}^{+0.50}\]$](/articles/aa/full_html/2025/12/aa57031-25/aa57031-25-eq34.png) , and
, and ![Mathematical equation: $\[0.19_{-0.12}^{+0.33}\]$](/articles/aa/full_html/2025/12/aa57031-25/aa57031-25-eq35.png) . Although the uncertainties are large, in three of four stars, we exclude a pure r-process origin for the Ba isotopes. The obtained values agree within the error bars with the s-process Fodd = 0.10 and the solar Fodd = 0.18 predicted by Prantzos et al. (2020).
. Although the uncertainties are large, in three of four stars, we exclude a pure r-process origin for the Ba isotopes. The obtained values agree within the error bars with the s-process Fodd = 0.10 and the solar Fodd = 0.18 predicted by Prantzos et al. (2020).CEMP-rs stars show higher Fodd than the CEMP-s stars with Fodd =
![Mathematical equation: $\[0.34_{-0.21}^{+0.55}\]$](/articles/aa/full_html/2025/12/aa57031-25/aa57031-25-eq36.png) ,
, ![Mathematical equation: $\[0.36_{-0.14}^{+0.23}\]$](/articles/aa/full_html/2025/12/aa57031-25/aa57031-25-eq37.png) ,
, ![Mathematical equation: $\[0.44_{-0.22}^{+0.43}\]$](/articles/aa/full_html/2025/12/aa57031-25/aa57031-25-eq38.png) ,
, ![Mathematical equation: $\[0.53_{-0.38}^{+0.47}\]$](/articles/aa/full_html/2025/12/aa57031-25/aa57031-25-eq39.png) , and
, and ![Mathematical equation: $\[0.57_{-0.31}^{+0.43}\]$](/articles/aa/full_html/2025/12/aa57031-25/aa57031-25-eq40.png) . Although the uncertainties are large, in four of five stars, we exclude a pure s-process origin for the Ba isotopes. The obtained values agree within the error bars with the i-process Fodd = 0.6–0.8 predicted by Choplin et al. (2025).
. Although the uncertainties are large, in four of five stars, we exclude a pure s-process origin for the Ba isotopes. The obtained values agree within the error bars with the i-process Fodd = 0.6–0.8 predicted by Choplin et al. (2025).In CEMP-rs stars with [Ba/Eu] > 0, their [Ba/Eu] and Fodd cannot be jointly explained by a mixture of material produced by the r- and s-processes. We argue that the i-process causes the chemical composition of these stars.
Data availability
Full Tables 2 and 3 are available at the CDS via https://cdsarc.cds.unistra.fr/viz-bin/cat/J/A+A/704/A103.
Acknowledgements
TS is grateful to Yu. V. Pakhomov for providing his code for echelle orders merging. Authors are grateful to Piercarlo Bonifacio and Elisabetta Caffau for providing their comments on the manuscript. A.C. is post-doctorate F.R.S-FNRS fellow.
References
- Abate, C., Pols, O. R., Izzard, R. G., & Karakas, A. I. 2015, A&A, 581, A22 [NASA ADS] [CrossRef] [EDP Sciences] [Google Scholar]
- Abate, C., Stancliffe, R. J., & Liu, Z.-W. 2016, A&A, 587, A50 [NASA ADS] [CrossRef] [EDP Sciences] [Google Scholar]
- Bailer-Jones, C. A. L. 2015, PASP, 127, 994 [Google Scholar]
- Beers, T. C., & Christlieb, N. 2005, ARA&A, 43, 531 [NASA ADS] [CrossRef] [Google Scholar]
- Bisterzo, S., Gallino, R., Straniero, O., Cristallo, S., & Käppeler, F. 2011, MNRAS, 418, 284 [Google Scholar]
- Butler, K. 1984, Ph.D. Thesis, University of London, UK [Google Scholar]
- Casagrande, L., & VandenBerg, D. A. 2018, MNRAS, 479, L102 [NASA ADS] [CrossRef] [Google Scholar]
- Choplin, A., Siess, L., & Goriely, S. 2022a, A&A, 662, C3 [NASA ADS] [CrossRef] [EDP Sciences] [Google Scholar]
- Choplin, A., Siess, L., & Goriely, S. 2022b, A&A, 667, A155 [NASA ADS] [CrossRef] [EDP Sciences] [Google Scholar]
- Choplin, A., Siess, L., Goriely, S., & Martinet, S. 2024, A&A, 684, A206 [NASA ADS] [CrossRef] [EDP Sciences] [Google Scholar]
- Choplin, A., Goriely, S., Siess, L., & Martinet, S. 2025, Eur. Phys. J. A, 61, 68 [Google Scholar]
- Cowley, C. R., & Frey, M. 1989, ApJ, 346, 1030 [Google Scholar]
- Cristallo, S., Straniero, O., Piersanti, L., & Gobrecht, D. 2015, ApJS, 219, 40 [Google Scholar]
- Denissenkov, P. A., Herwig, F., Woodward, P., et al. 2019, MNRAS, 488, 4258 [Google Scholar]
- Frebel, A. 2018, Annu. Rev. Nucl. Part. Sci., 68, 237 [NASA ADS] [CrossRef] [Google Scholar]
- Giddings, J. 1981, Ph.D. Thesis, University of London [Google Scholar]
- Giribaldi, R. E., Van Eck, S., Merle, T., et al. 2023, A&A, 679, A110 [NASA ADS] [CrossRef] [EDP Sciences] [Google Scholar]
- Giribaldi, R. E., Magrini, L., Schiappacasse-Ulloa, J., Randich, S., & Merle, T. 2025, A&A, 702, A65 [NASA ADS] [CrossRef] [EDP Sciences] [Google Scholar]
- Goswami, P. P., Rathour, R. S., & Goswami, A. 2021, A&A, 649, A49 [NASA ADS] [CrossRef] [EDP Sciences] [Google Scholar]
- Grevesse, N., & Sauval, A. J. 1999, A&A, 347, 348 [NASA ADS] [Google Scholar]
- Gustafsson, B., Edvardsson, B., Eriksson, K., et al. 2008, A&A, 486, 951 [NASA ADS] [CrossRef] [EDP Sciences] [Google Scholar]
- Hampel, M., Stancliffe, R. J., Lugaro, M., & Meyer, B. S. 2016, ApJ, 831, 171 [Google Scholar]
- Hansen, T., Hansen, C. J., Christlieb, N., et al. 2015, ApJ, 807, 173 [Google Scholar]
- Hansen, C. J., Hansen, T. T., Koch, A., et al. 2019, A&A, 623, A128 [NASA ADS] [CrossRef] [EDP Sciences] [Google Scholar]
- Hill, V., Barbuy, B., Spite, M., et al. 2000, A&A, 353, 557 [NASA ADS] [Google Scholar]
- Jablonka, P., North, P., Mashonkina, L., et al. 2015, A&A, 583, A67 [NASA ADS] [CrossRef] [EDP Sciences] [Google Scholar]
- Jonsell, K., Barklem, P. S., Gustafsson, B., et al. 2006, A&A, 451, 651 [NASA ADS] [CrossRef] [EDP Sciences] [Google Scholar]
- Karinkuzhi, D., Van Eck, S., Goriely, S., et al. 2021, A&A, 645, A61 [EDP Sciences] [Google Scholar]
- Kochukhov, O. 2018, BinMag: Widget for comparing stellar observed with theoretical spectra, Astrophysics Source Code Library, [record ascl:1805.015] [Google Scholar]
- Lawler, J. E., Wickliffe, M. E., den Hartog, E. A., & Sneden, C. 2001, ApJ, 563, 1075 [CrossRef] [Google Scholar]
- Lindegren, L., Bastian, U., Biermann, M., et al. 2021, A&A, 649, A4 [EDP Sciences] [Google Scholar]
- Lodders, K. 2021, Space Sci. Rev., 217, 44 [NASA ADS] [CrossRef] [Google Scholar]
- Lodders, K., Palme, H., & Gail, H. P. 2009, Landolt Börnstein, 4B, 712 [Google Scholar]
- Lucatello, S., Tsangarides, S., Beers, T. C., et al. 2005, ApJ, 625, 825 [NASA ADS] [CrossRef] [Google Scholar]
- Mashonkina, L. I., & Belyaev, A. K. 2019, Astron. Lett., 45, 341 [NASA ADS] [CrossRef] [Google Scholar]
- Mashonkina, L., & Gehren, T. 2000, A&A, 364, 249 [NASA ADS] [Google Scholar]
- Mashonkina, L., & Smogorzhevskii, A. 2025, A&A, accepted [Google Scholar]
- Mashonkina, L., & Zhao, G. 2006, A&A, 456, 313 [NASA ADS] [CrossRef] [EDP Sciences] [Google Scholar]
- Mashonkina, L., Zhao, G., Gehren, T., et al. 2008, A&A, 478, 529 [NASA ADS] [CrossRef] [EDP Sciences] [Google Scholar]
- Mashonkina, L., Gehren, T., Shi, J.-R., Korn, A. J., & Grupp, F. 2011, A&A, 528, A87 [NASA ADS] [CrossRef] [EDP Sciences] [Google Scholar]
- Mashonkina, L., Sitnova, T., Yakovleva, S. A., & Belyaev, A. K. 2019, A&A, 631, A43 [NASA ADS] [CrossRef] [EDP Sciences] [Google Scholar]
- Mashonkina, L., Pakhomov, Y., Sitnova, T., et al. 2023, MNRAS, 524, 3526 [Google Scholar]
- Masseron, T., Johnson, J. A., Plez, B., et al. 2010, A&A, 509, A93 [NASA ADS] [CrossRef] [EDP Sciences] [Google Scholar]
- Miles, B. M., & Wiese, W. L. 1969, Atomic Data, 1, 1 [NASA ADS] [CrossRef] [Google Scholar]
- Mucciarelli, A., Bellazzini, M., & Massari, D. 2021, A&A, 653, A90 [NASA ADS] [CrossRef] [EDP Sciences] [Google Scholar]
- Pakhomov, Y. V., Ryabchikova, T. A., & Piskunov, N. E. 2019, Astron. Rep., 63, 1010 [NASA ADS] [CrossRef] [Google Scholar]
- Prantzos, N., Abia, C., Cristallo, S., Limongi, M., & Chieffi, A. 2020, MNRAS, 491, 1832 [Google Scholar]
- Preston, G. W., & Sneden, C. 2001, AJ, 122, 1545 [Google Scholar]
- Raassen, A. J. J., & Uylings, P. H. M. 1998, A&A, 340, 300 [Google Scholar]
- Ryabchikova, T., Piskunov, N., Kurucz, R. L., et al. 2015, Phys. Scr, 90, 054005 [Google Scholar]
- Schlafly, E. F., & Finkbeiner, D. P. 2011, ApJ, 737, 103 [Google Scholar]
- Shulyak, D., Tsymbal, V., Ryabchikova, T., Stütz, C., & Weiss, W. W. 2004, A&A, 428, 993 [NASA ADS] [CrossRef] [EDP Sciences] [Google Scholar]
- Sitnova, T., Zhao, G., Mashonkina, L., et al. 2015, ApJ, 808, 148 [Google Scholar]
- Sitnova, T. M., Lombardo, L., Mashonkina, L. I., et al. 2025, A&A, 699, A262 [NASA ADS] [CrossRef] [EDP Sciences] [Google Scholar]
- Spite, M., Caffau, E., Bonifacio, P., et al. 2013, A&A, 552, A107 [NASA ADS] [CrossRef] [EDP Sciences] [Google Scholar]
- Tsymbal, V., Ryabchikova, T., & Sitnova, T. 2019, in Astronomical Society of the Pacific Conference Series, 518, Physics of magnetic stars, eds. I. I. Romanyuk, I. A. Yakunin, & D. O. Kudryavtsev, 247 [Google Scholar]
We use a standard designation, [X/Y] = log(NX/NY)* − log(NX/NY)⊙, where NX and NY are total number densities of elements X and Y, respectively.
All Tables
Stellar sample, atmospheric parameters, and characteristics of the observed spectra.
Impact of the uncertainties in the stellar parameters on the abundances from different lines.
All Figures
|
Fig. 1 NLTE abundance corrections for the Ba II lines as a function of EWs. See the legend for the line designations. |
| In the text | |
|
Fig. 2 Differences between NLTE abundances from individual lines computed with Fodd = 0.10 (s-process) and 0.75 (r-process) in the sample stars known in the literature as CEMP-s (circles) and CEMP-rs (squares), and in stars with an unclear classification (triangles). For comparison, we show data for normal VMP stars from Sitnova et al. (2025, diamonds). The open and filled symbols correspond to the Ba II 4554 Å and 4934 Å lines, respectively. |
| In the text | |
|
Fig. 3 Differences between NLTE abundances from the subordinate and the resonance Ba II lines computed with Fodd = 0.10 (s-process, filled symbols) and 0.75 (r-process, open symbols) in the sample stars known in the literature as CEMP-s (circles) and CEMP-rs (squares), and in stars with an unclear classification (triangles). |
| In the text | |
|
Fig. 4 Fodd as a function of [Ba/Eu] in the sample stars. The designations are the same as in Fig. 3. For comparison, we show the theoretical predictions for r-process (dashed line), s-process (dashdotted line), s- and r-process material mixture (dotted line), and i-process (diamonds). The filled diamonds correspond to i-process models with [Fe/H] and [Ba/Fe] that fall in the parameter range of our sample stars. The blue error bar indicates i-process nuclear uncertainties associated with the 1 m⊙ model with [Fe/H] = −2.5. |
| In the text | |
Current usage metrics show cumulative count of Article Views (full-text article views including HTML views, PDF and ePub downloads, according to the available data) and Abstracts Views on Vision4Press platform.
Data correspond to usage on the plateform after 2015. The current usage metrics is available 48-96 hours after online publication and is updated daily on week days.
Initial download of the metrics may take a while.