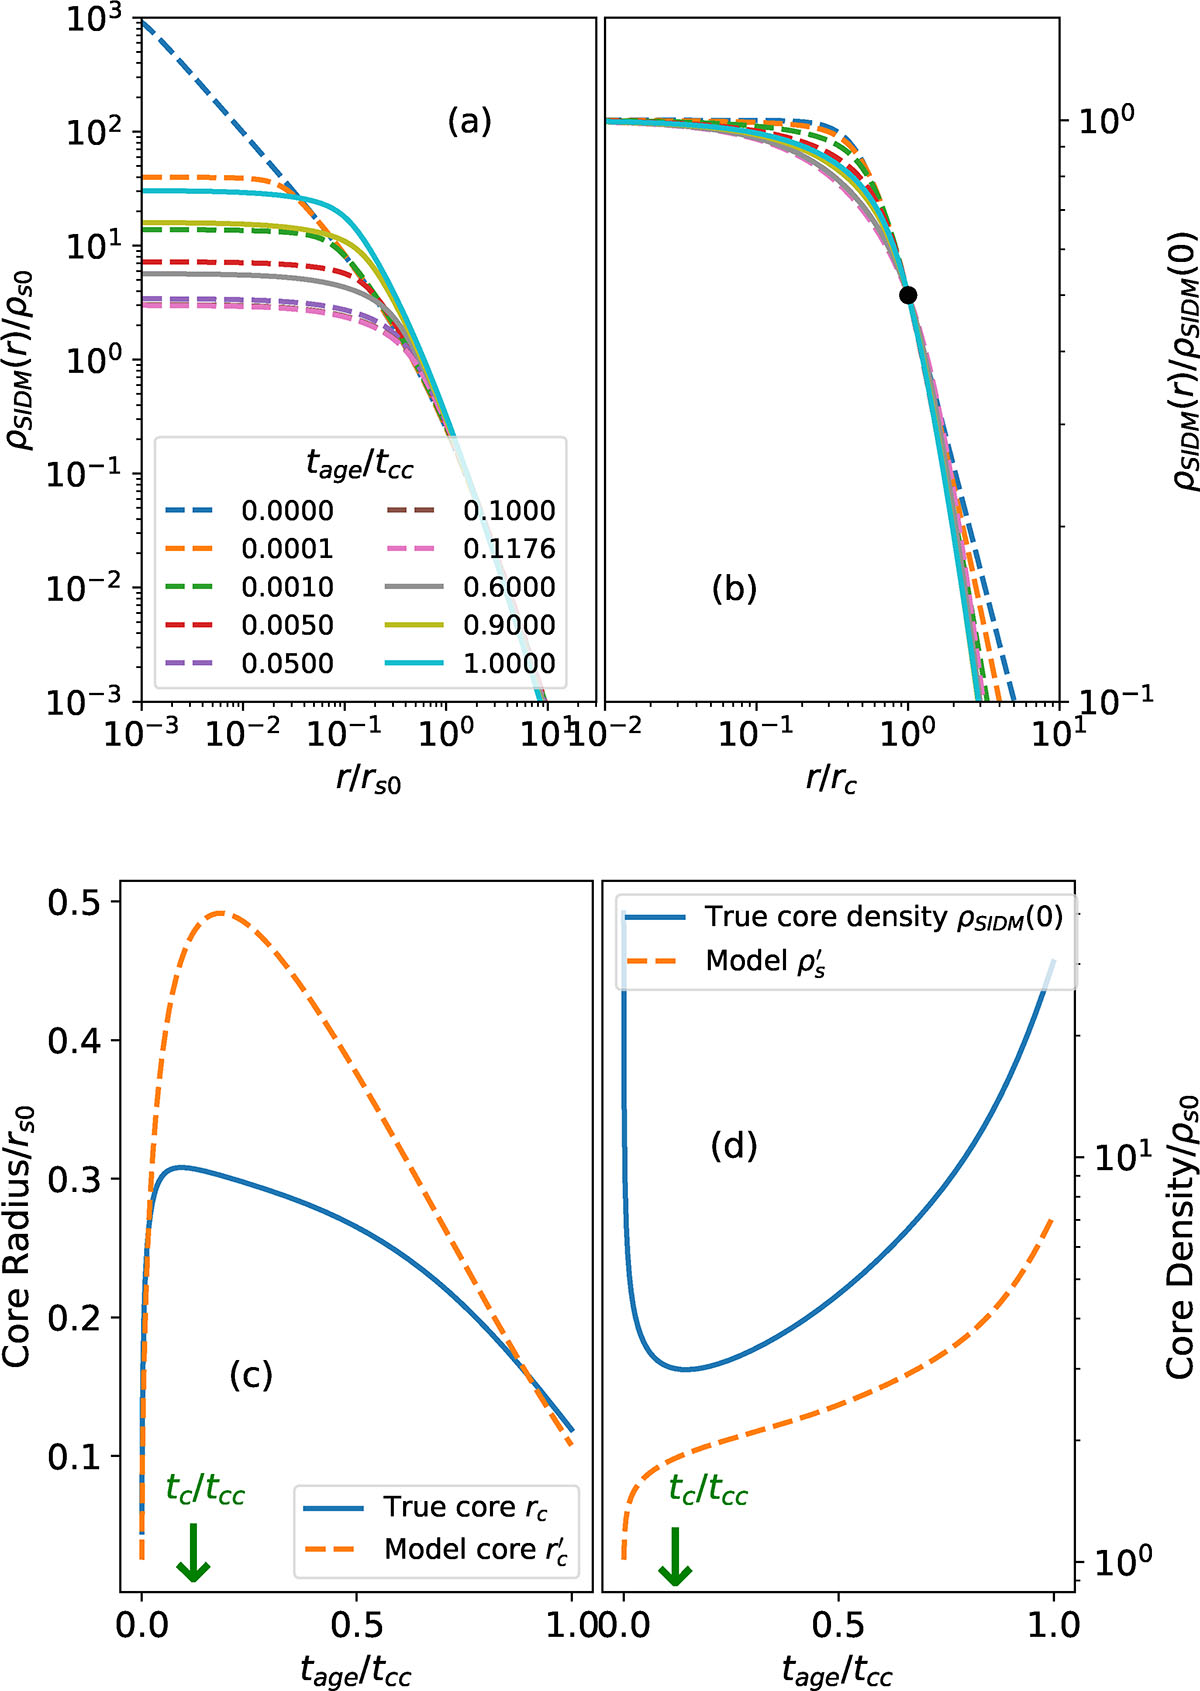
Fig. 1.
Download original image
Time evolution of SIDM halos according to Yang et al. (2024). The timescale is parameterized in terms of the core-collapse timescale, tcc – Eqs. (3) and (7). The halos start off as NFW profiles of characteristic density and radius ρs0 and rs0, respectively. (a) Radial density at different timesteps going from almost the initial conditions (tage/tcc = 0) to core-collapse (tage/tcc = 1), including the formation of a maximum core (tage/tcc = tc/tcc ≃ 0.12). Profiles before the maximum core formation (tage ≤ tc) are represented as dashed lines whereas profiles after this core-formation are shown as solid lines. (b) Same profiles as (a) but normalized to the central density and to the core radius defined in Eq. (6). The black bullet symbol indicates the location of the core radius. (c) Time variation of the true core (the blue solid line; rc in Eq. (17)) and of the model core (the orange dashed line; r′c in Eq. (15)). (d) Time variation of the central density (the blue solid line; ρSIDM(0)) and of the characteristic density (the orange dashed line; ρs′ in Eq. (15)). The green arrow in (c) and (d) marks the timescale for maximum core formation.
Current usage metrics show cumulative count of Article Views (full-text article views including HTML views, PDF and ePub downloads, according to the available data) and Abstracts Views on Vision4Press platform.
Data correspond to usage on the plateform after 2015. The current usage metrics is available 48-96 hours after online publication and is updated daily on week days.
Initial download of the metrics may take a while.