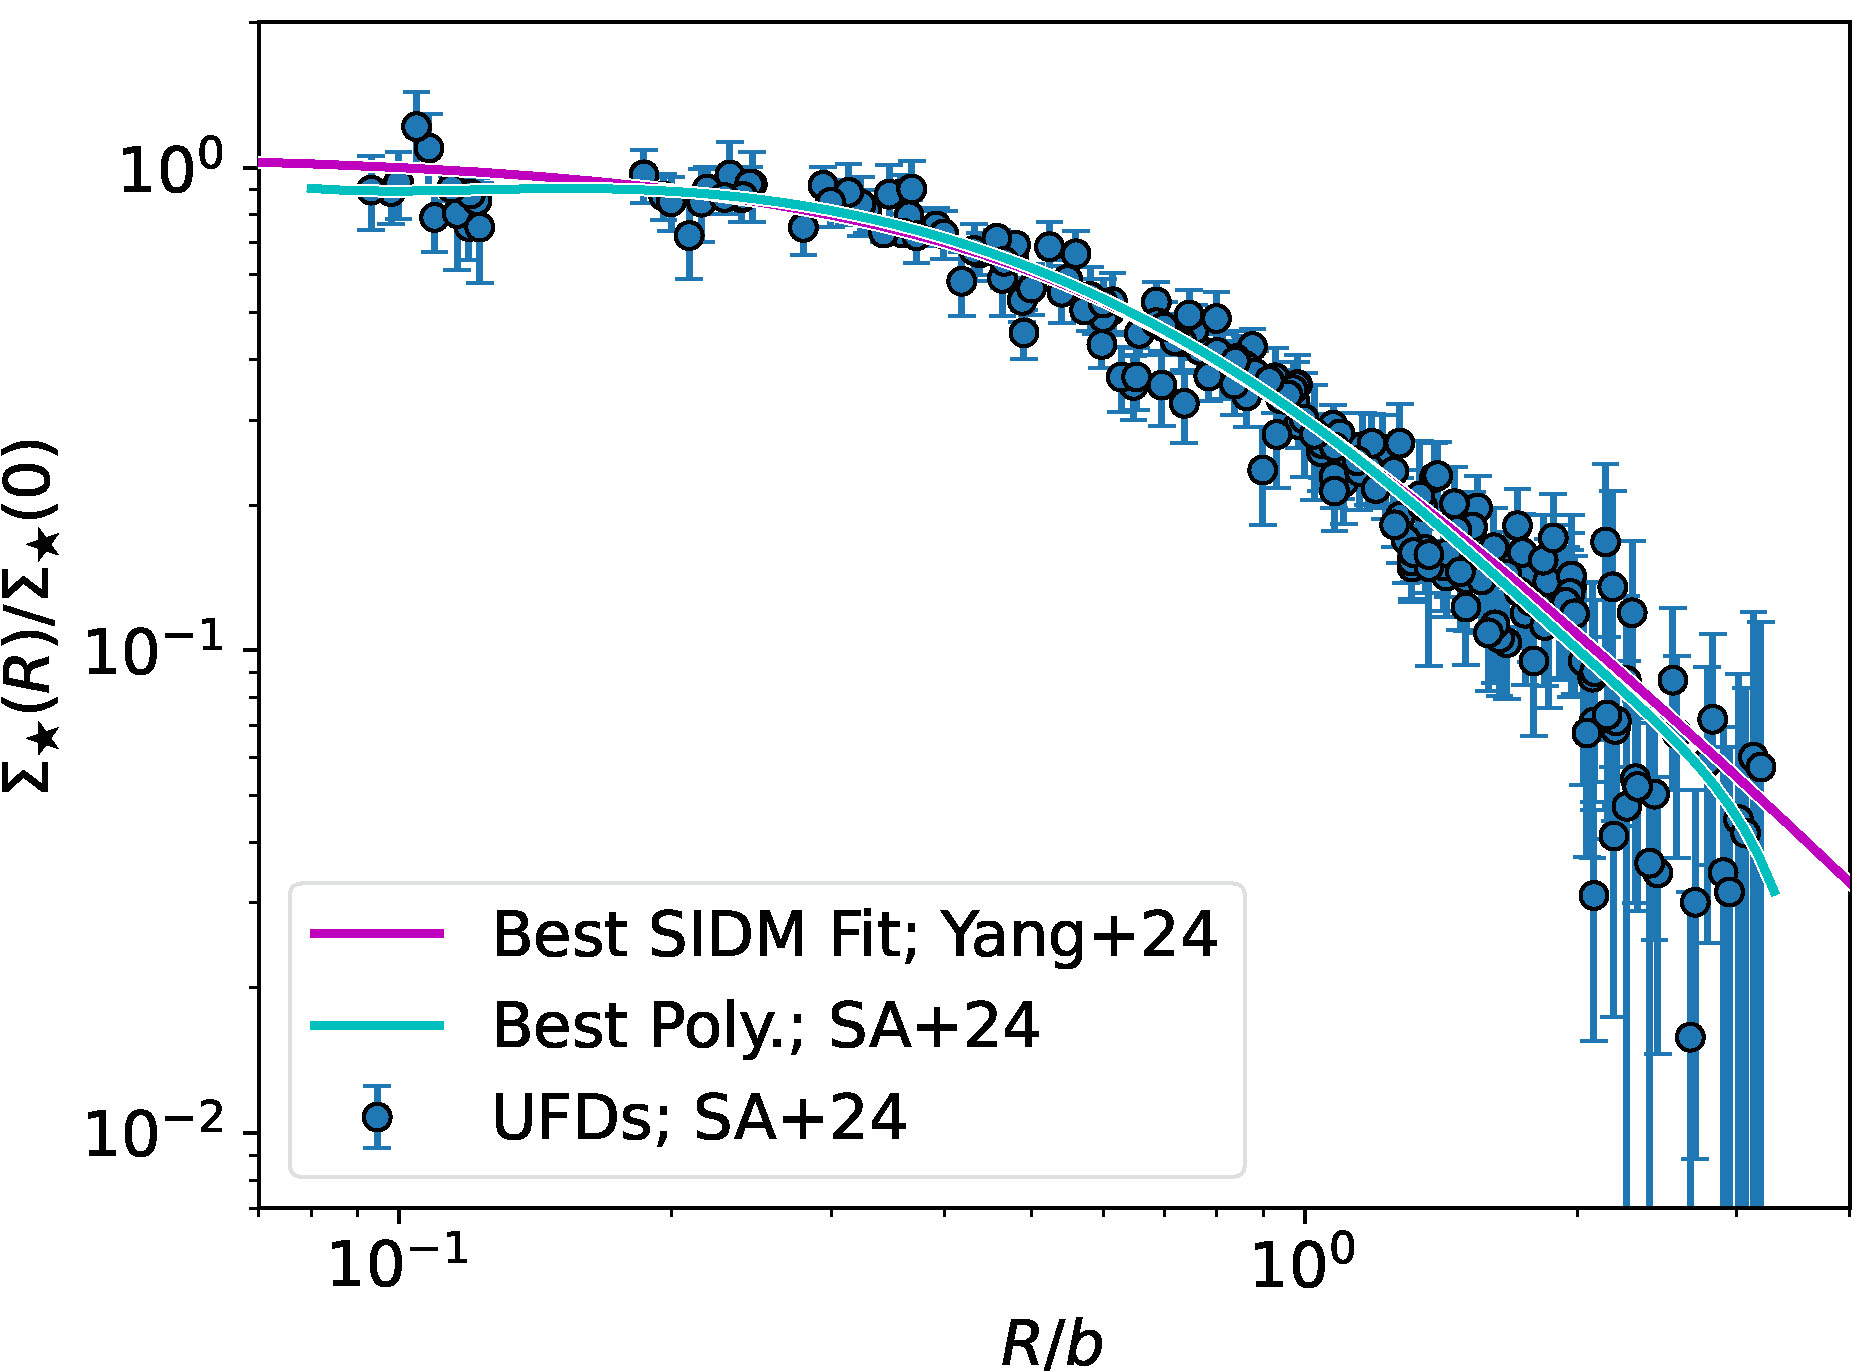
Fig. D.1.
Download original image
Observed stellar surface density distribution for the six UFDs analyzed in this work as worked out in Sánchez Almeida et al. (2024a, their Fig. 1). It is well reproduced by the line-of-sight projection of the SIDM profile used in Sect. 3. The magenta line corresponds to the best fit using one such profile. The figure also includes the polynomial fit to Σ★(R) given by Sánchez Almeida et al. (2024a, the solid cyan line). Here R stands for the projected radial distance from the center of the galaxy, and b is a radial scaling factor, different for the different dwarfs, that allows the whole set of dwarfs to collapse to a single shape.
Current usage metrics show cumulative count of Article Views (full-text article views including HTML views, PDF and ePub downloads, according to the available data) and Abstracts Views on Vision4Press platform.
Data correspond to usage on the plateform after 2015. The current usage metrics is available 48-96 hours after online publication and is updated daily on week days.
Initial download of the metrics may take a while.