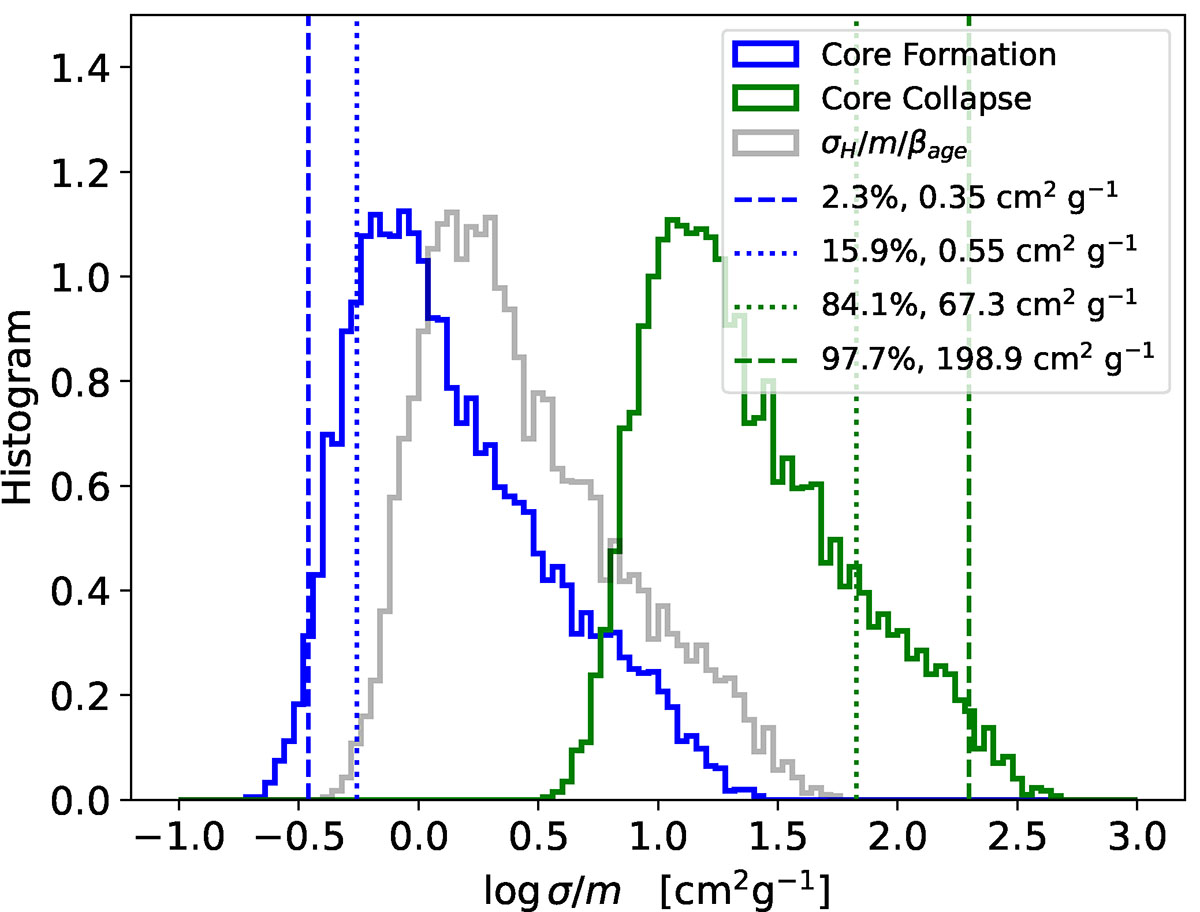
Fig. 2.
Download original image
Monte Carlo simulation used to estimate the SIDM cross sections required to account for the DM cores of UFDs. The cross sections depend on a number of poorly constrained parameters (the parameters in Eq. (10)). The Monte Carlo simulations allow us to propagate their uncertainties on σH/m/βage (the gray histogram) and, via Eq. (9), on the cross section σ/m. The blue histogram represents the distribution assuming the UFDs are in the process of forming the core, whereas the green histogram assumes that DM is evolving into the core-collapse phase. The vertical dashed lines mark the 2.3% and 97.7% percentiles used to constrain the range of viable cross sections given in Eq. (11). See the main text for further details.
Current usage metrics show cumulative count of Article Views (full-text article views including HTML views, PDF and ePub downloads, according to the available data) and Abstracts Views on Vision4Press platform.
Data correspond to usage on the plateform after 2015. The current usage metrics is available 48-96 hours after online publication and is updated daily on week days.
Initial download of the metrics may take a while.