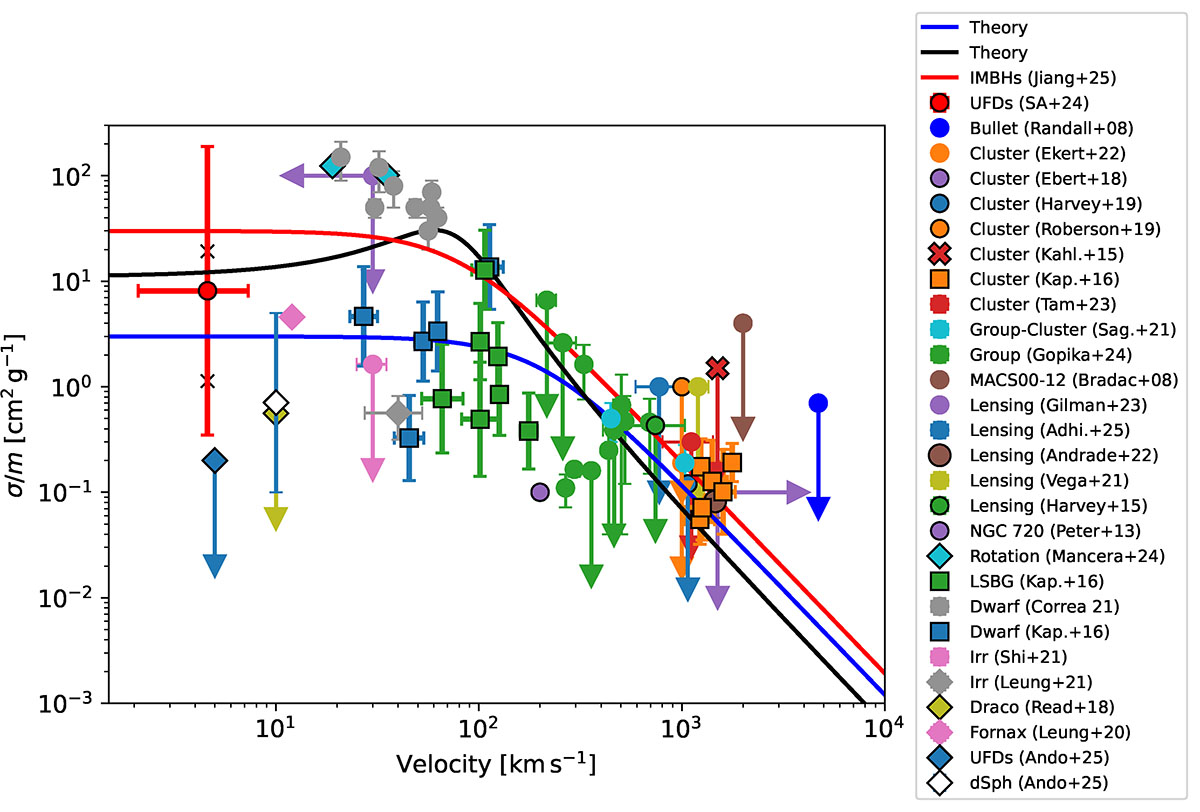
Fig. 3.
Download original image
SIDM cross sections found in the literature versus a representative relative velocity of the DM particles in the observed object. See Appendix A for the full references explaining that σ/m and “Velocity” have different meanings in the different works, which may explain part of the scatter. The value provided by the UFDs analyzed in this work is shown with the red circle with error bars. The two times symbols represent the median of the core formation and the core-collapse distributions shown in Fig. 2. The solid lines corresponds to the analytical form in Eq. (18), where σ0/m, w0, w1 = 30 cm2 g−1, 0, 80 km s−1 (the red line), 3 cm2 g−1, 0, 200 km s−1 (the blue line), and 11 cm2 g−1, 60 km s−1, 45 km s−1 (the black line).
Current usage metrics show cumulative count of Article Views (full-text article views including HTML views, PDF and ePub downloads, according to the available data) and Abstracts Views on Vision4Press platform.
Data correspond to usage on the plateform after 2015. The current usage metrics is available 48-96 hours after online publication and is updated daily on week days.
Initial download of the metrics may take a while.