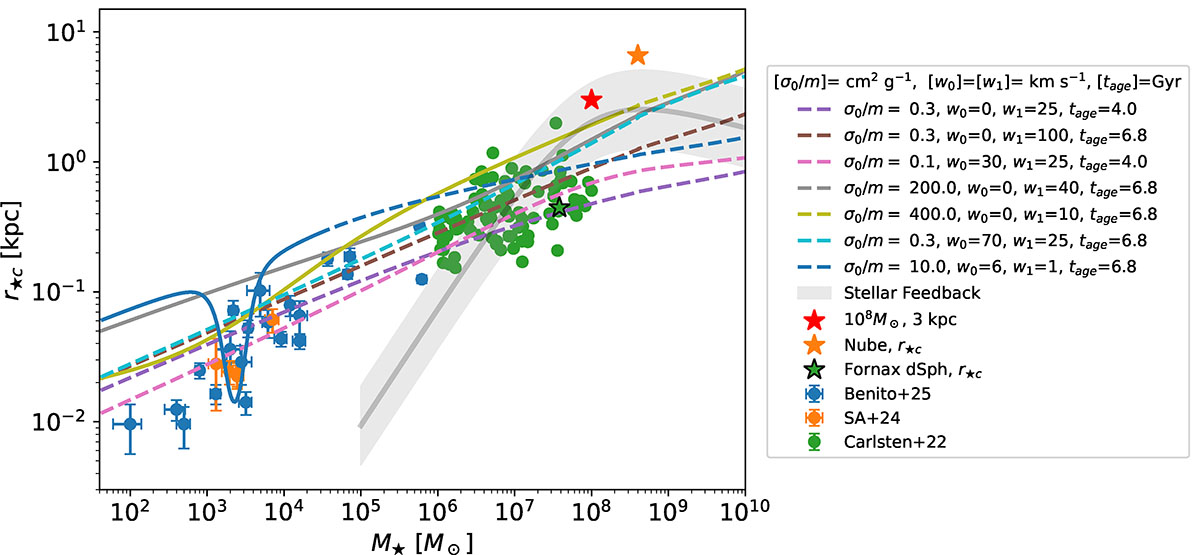
Fig. 4.
Download original image
Stellar core radius versus stellar mass as predicted by the simple model presented in Sect. 3. Each line shows the variation in r★c with M★ when the DM halo mass goes from 107 to 1014 M⊙. The type of line depends on whether the corresponding profile is in the core-formation phase (tage < tc; dashed line) or the core-collapse phase (tage > tc; solid line). The parameters that define the cross sections are given in the inset, with the actual velocity dependence represented in Fig. 5 with the same color code employed here. Observations of r★c versus M★ are represented as symbols, each one corresponding to an individual object. The measurements are labeled in the inset, with the UFDs analyzed in this work appearing under the label SA+24. The link between labels and references is specified in Appendix C. The figure also includes the theoretical expectations from stellar feedback on CDM halos from Lazar et al. (2020, the gray band and solid line).
Current usage metrics show cumulative count of Article Views (full-text article views including HTML views, PDF and ePub downloads, according to the available data) and Abstracts Views on Vision4Press platform.
Data correspond to usage on the plateform after 2015. The current usage metrics is available 48-96 hours after online publication and is updated daily on week days.
Initial download of the metrics may take a while.