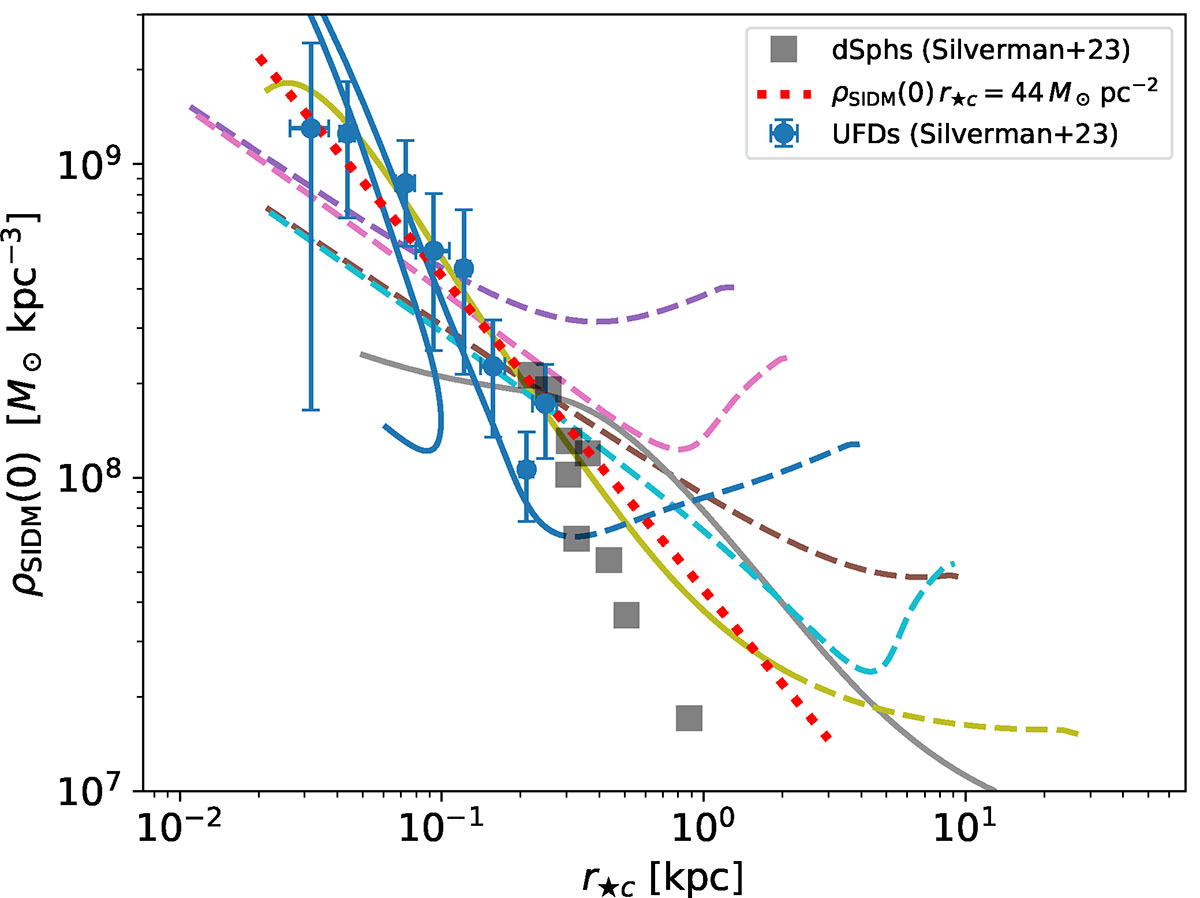
Fig. 6.
Download original image
Central density of the SIDM profiles used in Fig. 4 versus the stellar core radius. The color code employed in Figs. 4 and 5 is also used here. As in Fig. 4, the line is dashed or solid depending on whether the corresponding profile is in the core-formation phase (dashed line) or the core-collapse phase (solid line). The figure also includes a number of observed densities for UFDs and dSph collected by Silverman et al. (2023, their Fig. 10). The range of central densities observed in UFDs is covered by the SIDM simulations, both in the core-formation and the core-collapse phase. The increase in the central density with decreasing radius is consistent with the observations that the product central density times the core radius tends to be constant regardless of the DM halo mass, with a value of around 44 M⊙ pc−2. This trend is represented as the dotted red line, assuming rc ≃ r★c.
Current usage metrics show cumulative count of Article Views (full-text article views including HTML views, PDF and ePub downloads, according to the available data) and Abstracts Views on Vision4Press platform.
Data correspond to usage on the plateform after 2015. The current usage metrics is available 48-96 hours after online publication and is updated daily on week days.
Initial download of the metrics may take a while.