Fig. 3.
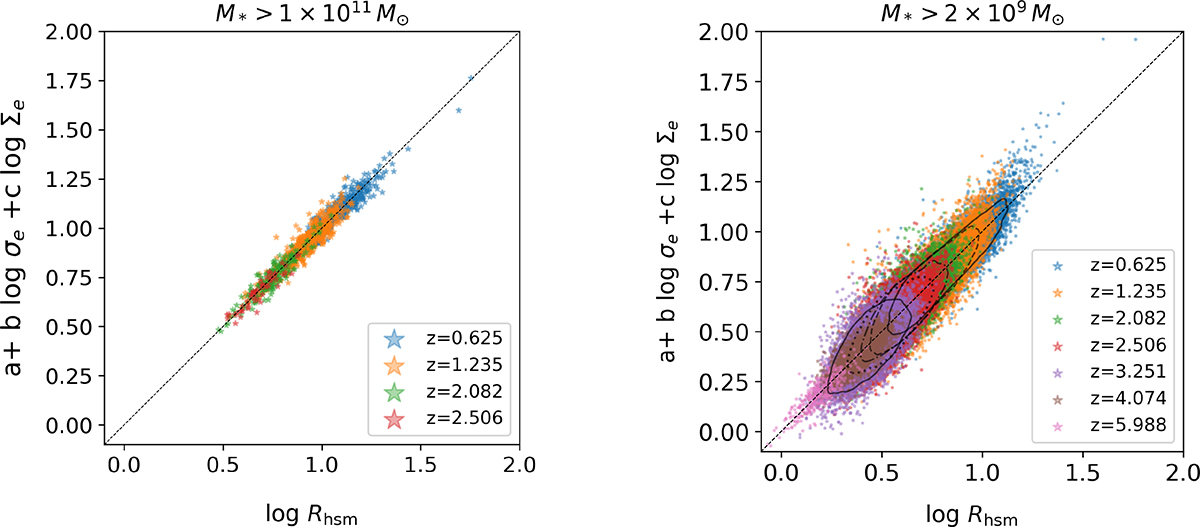
Download original image
Redshift evolution of SM-FP for the spheroidal galaxies in HR5. Note that galaxies are located along the diagonal line as the best-fit FP coefficients are used at each redshift. The relation moves to the right as galaxies grow in size with time. Left: For the massive sub-sample with M* > 1 × 10¹¹ M⊙Right: For the sample with M* > 2 × 10⁹ M⊙. To mitigate the overlap of points, black contours are plotted for the initial five redshifts, representing the central 90% of galaxies contained within.
Current usage metrics show cumulative count of Article Views (full-text article views including HTML views, PDF and ePub downloads, according to the available data) and Abstracts Views on Vision4Press platform.
Data correspond to usage on the plateform after 2015. The current usage metrics is available 48-96 hours after online publication and is updated daily on week days.
Initial download of the metrics may take a while.