| Issue |
A&A
Volume 704, December 2025
|
|
|---|---|---|
| Article Number | A315 | |
| Number of page(s) | 12 | |
| Section | Extragalactic astronomy | |
| DOI | https://doi.org/10.1051/0004-6361/202557050 | |
| Published online | 19 December 2025 | |
Redshift evolution of the fundamental plane up to z ∼6
Insights from Horizon Run 5 simulations
1
Korea Institute for Advanced Study, 85 Hoegiro, Dongdaemun-gu, Seoul 02455, Republic of Korea
2
Korea Astronomy and Space Science Institute, 776 Daedeok-daero, Yuseong-gu, Daejeon 34055, Republic of Korea
3
Astronomy Campus, University of Science and Technology, 776 Daedeok-daero, Yuseong-gu, Daejeon 34055, Republic of Korea
4
E.A. Milne Centre for Astrophysics, University of Hull, Hull HU6 7RX, United Kingdom
5
Institut d’Astrophysique de Paris, CNRS, Sorbonne Université, UMR 7095, 98 bis boulevard Arago, 75014 Paris, France
6
Kyung Hee University, Department of Astronomy and Space Science, Yongin-si, Gyeonggi-do 17104, Republic of Korea
7
Center for Advanced Computation, Korea Institute for Advanced Study, 85 Hoegiro, Dongdaemun-gu, Seoul 02455, Republic of Korea
★ Corresponding author: This email address is being protected from spambots. You need JavaScript enabled to view it.
Received:
31
August
2025
Accepted:
14
October
2025
Abstract
Context. The fundamental plane (FP) is an empirical scaling relation linking the structure and dynamics of early-type galaxies. However, the traditionally used luminosity-based FP is sensitive to variations in stellar populations and dust, limiting its reliability at high redshifts.
Aims. We investigate the redshift evolution of the stellar mass fundamental plane (SM-FP) as a more physically motivated alternative, using a sample of spheroidal galaxies selected from the Horizon Run 5 (HR5) cosmological hydrodynamical simulation.
Methods. We selected spheroidal galaxies mainly based on morphological criteria, using structural parameters such as the asymmetry parameter (A) and the Sérsic index (nSérsic), and constructed the SM-FP by replacing surface brightness with stellar mass surface density. We then studied the evolution of the FP parameters and its scatter over the redshift range from z = 0.625 to z = 6.
Results. Our analysis reveals a well-defined SM-FP existing as early as z ∼ 6, exhibiting a low intrinsic scatter (∼0.07 dex). The FP slope parameters evolve systematically, with the velocity dispersion coefficient decreasing and the surface density coefficient also decreasing in magnitude towards higher redshifts. The FP tightness improves when selecting slow rotators with Vrot/σe < 0.55. Additionally, we observe systematic dependencies of FP residuals on the stellar age, specific star formation rate (sSFR), and Vrot/σe, highlighting the importance of internal kinematics over age or sSFR in defining the FP.
Conclusions. Our results demonstrate that the structural and dynamical scaling relations of spheroidal galaxies were established early in cosmic history, with the SM-FP established robustly by z ≈ 6. The systematic evolution of FP parameters with redshift can provide crucial insights into the processes governing galaxy assembly and morphological evolution.
Key words: Galaxy: evolution / Galaxy: general / galaxies: fundamental parameters
© The Authors 2025
 Open Access article, published by EDP Sciences, under the terms of the Creative Commons Attribution License (https://creativecommons.org/licenses/by/4.0), which permits unrestricted use, distribution, and reproduction in any medium, provided the original work is properly cited.
This article is published in open access under the Subscribe to Open model. This email address is being protected from spambots. You need JavaScript enabled to view it. to support open access publication.
1. Introduction
Elliptical galaxies exhibit a well-known empirical relationship between their effective radius (Re), central velocity dispersion (σe), and effective surface brightness (Ie), referred to as the fundamental plane (FP) (Djorgovski & Davis 1987; Dressler et al. 1987). The FP can be understood as a consequence of the virial equilibrium with homology and a constant mass-to-light ratio (M/L) among galaxies (Binney & Tremaine 2011). This relationship can be expressed as Re ∝ σebIec. According to the virial theorem, the theoretical values of these coefficients are b = 2 and c = −1. However, observational studies at low redshifts have empirically determined the values to be b ∼ 1.2 and c ∼ −0.8 (Jørgensen et al. 1996). Thus, observations reveal a tilt in the FP (Scodeggio et al. 1998; Trujillo et al. 2004; Hyde & Bernardi 2009; Cappellari et al. 2013) compared to the theoretical prediction for the virial equilibrium.
The evolutionary processes in elliptical galaxies, including changes in their structure, stellar populations, and mass-to-light ratios, cause FP slope parameters to evolve with redshift, leading to a rotation of the plane over cosmic time. In practice, values for the FP coefficients have been found to lie in the range b ≃ [0.4, 1.5] and c ≃ [ − 0.9, −0.4], depending on the chosen wavelength band and fitting method, as well as on redshift (van Dokkum & Franx 1996; Hyde & Bernardi 2009; Saglia et al. 2010; Jørgensen & Chiboucas 2013; Hou & Wang 2015; Stockmann et al. 2021). However, the evolution of the FP through observations has only been studied up to relatively low redshifts, z ∼ 2 (van de Sande et al. 2014; Stockmann et al. 2021). Spectroscopic observations needed to obtain high signal-to-noise spectra and measure stellar velocity dispersion at redshifts beyond 2 have proven challenging. So far, only the brightest galaxies have been studied at these early epochs (van de Sande et al. 2013; Belli et al. 2017; Stockmann et al. 2019), which might have resulted in a selection bias.
Most FP studies to date have focused on the luminosity-based FP (L-FP), which is highly sensitive to variations in stellar populations, dust attenuation, and observational wavelength. This becomes especially problematic at high redshifts, where rest-frame optical light shifts into the ultraviolet, tracing younger and more massive stellar populations and thereby failing to reliably trace the underlying mass distribution. The availability of stellar mass estimates from broadband photometry allows one to study the stellar mass FP (SM-FP), whereby surface brightness is replaced by the stellar surface mass density, Σe = M*/2πRe2 (Hyde & Bernardi 2009; Bezanson et al. 2013; Hou & Wang 2016; Bernardi et al. 2020). The SM-FP is closer to the virial plane and enables a more physically meaningful interpretation of FP evolution.
Despite extensive observational efforts, the exact nature, origin, and evolution of the FP over cosmic time remain topics of active research. In recent years, various advanced cosmological hydrodynamical simulations including Horizon simulations (Dubois et al. 2014), EAGLE simulations (Schaye et al. 2015; Crain et al. 2015), the Next Generation Illustris (IllustrisTNG) simulations (Pillepich et al. 2018; Springel et al. 2018; Naiman et al. 2018; Marinacci et al. 2018; Nelson et al. 2018), the Magneticum Pathfinder simulation suite (Hirschmann et al. 2014; Teklu et al. 2015), and the Horizon Run 5 simulation (Lee et al. 2021; Park et al. 2022), incorporating complex physical processes such as star formation, feedback mechanisms, and interactions with dark matter provide a complementary approach to study the formation and evolution of galaxies (Snyder et al. 2015; Dubois et al. 2016; Correa et al. 2017; Park et al. 2022).
Recently, Lu et al. (2020) examined the L-FP (slopes, scatter, and zero-point) in the IllustrisTNG-100 simulation, finding a plane with mild evolution in its coefficients and a mass–plane relation in place, with a small scatter (∼0.08 dex) since z = 2. Their trends shows good agreement with observations at lower redshifts (z < 1), while at higher redshifts (z > 1) discrepancies arise, potentially due to the larger sizes (Genel et al. 2018; Rodriguez-Gomez et al. 2019) and lower σe (Wang et al. 2020) of IllustrisTNG early-type galaxies (ETGs) compared with observations.
Rosito et al. (2021) found that Horizon-AGN ETGs identified at z = 0 follow the observed fundamental scaling relations (mass–plane, FP, and mass–size relation). However, in simulations without AGN feedback, galaxies deviate from the expected FP, with some showing excess stellar surface density, leading them to the conclusion that active galactic nucleus (AGN) feedback plays a critical role in regulating galaxy size, rotation, and star formation activity, impacting the overall alignment with observed relations. This study also highlights how AGN feedback influences the mass-to-light ratio (M/L) and the tilt of the L-FP, noting a redshift-dependent evolution of the FP based on stellar age and morphology. However, most simulations have only extended FP studies up to a redshift of 2 ∼ 3 due to their small volume and limited particle resolution. Also, the definition of the ETGs is different among simulations and observations, making quantitative comparison of results difficult. Some recent works have provided important complementary perspectives on the FP across cosmic time. The Magneticum Pathfinder simulations (Dolag et al. 2025) analysed the SM-FP from z ∼ 4 to z = 0, reporting stable slopes, a steadily evolving zero point, and a constant intrinsic scatter in log R of ∼0.06 dex over the full redshift range, despite significant evolution in galaxy sizes and surface mass densities. In contrast, D’Onofrio & Chiosi (2024) investigated the luminosity- FP for both simulations (Illustris, IllustrisTNG) and observations, introducing a time-dependent scaling to connect FP tilt to the degree of virialization. Their framework predicts that bright massive ETGs remain close to the virial plane throughout cosmic history, while low-mass and low-luminous systems deviate more strongly, especially at high redshifts (z ∼ 4). The HR5 analysis presented here builds on these results by providing an independent measurement of the SM-FP coefficients and their redshift evolution.
This paper aims to study the redshift evolution of SM-FP of a class of galaxies selected based on their spheroidal morphology and/or internal kinematics by utilizing the recent Horizon Run 5 cosmological simulation (Lee et al. 2021) – HR5 hereafter – which uniquely combines a large volume and high resolution to probe galactic objects up to z ∼ 6. By adopting stellar mass surface density in place of luminosity-based surface brightness (also presented in Appendix A), we construct a SM-FP that is less sensitive to stellar population variations and more directly reflects the underlying dynamical state of galaxies. In Sect. 2, we describe the HR5 simulation and the selection criteria used to identify spheroidal and slow-rotating galaxies based on their morphology and kinematics. In Sect. 3, we outline the FP fitting methodology, including the use of robust least trimmed squares (LTS) plane fitting. In Sect. 4, we present our main results on the redshift evolution of FP coefficients for both a massive sub-sample and a broader sample of spheroids with a smaller mass cut, as well as the impact of a Vrot/σe-based kinematic selection criterion on the FP coefficients. In Sect. 5, we present a discussion emphasizing the importance of studying the SM-FP instead of the L-FP. We examine the mass dependence of the FP parameters, analyse how various stellar properties – such as the age, rotational velocity to stellar velocity dispersion ratio (Vrot/σe), and sSFR – vary along the FP, and compare our results with previous studies, including both observational data and simulations. We summarize our main conclusions in Sect. 6, highlighting the early emergence and persistence of the FP.
2. Data and methods
2.1. Simulation
The HR5 simulation (Lee et al. 2021) is a state-of-the-art cosmological hydrodynamical simulation that covers a volume of about (1048.6 cMpc)3, while achieving a resolution of ∼1 pkpc in the zoom-in region. The cosmological parameters adopted are based on the Planck observation (Planck Collaboration XIII 2016), with Ωm = 0.3, ΩΛ = 0.7, Ωb = 0.047, σ8 = 0.816, and h = 0.684. The initial conditions for the simulation are generated at z = 200 with the MUSIC package (Hahn & Abel 2011) using second-order Lagrangian perturbation theory (2LPT; Scoccimarro 1998; Jenkins 2010).
The HR5 simulation was run using the adaptive mesh refinement code RAMSES (Teyssier 2002). The RAMSES code was modified to implement OpenMP parallelism in addition to the Message Passing Interface already compatible with RAMSES. The Poisson equations and Euler equations were solved based on the particle mesh algorithm (Guillet & Teyssier 2011) and the Hartex-Lax-van Leer contact wave Riemann solver (Toro et al. 1994), respectively. All particles of dark matter, stars, and massive black holes were assigned into grids using the cloud-in-cell mass assignment scheme to construct mass-density grids.
The initial density field in a periodic box of 1048.6 cMpc size was generated on a coarse 2563 grid in which each cell size was 4.096 cMpc. A high-resolution cuboid region of volume 1048.6 × 119.0 × 127.2 cMpc3 was set at the centre of the simulation box. This high-resolution region has 8192 grids (dx = 0.128cMpc) along the long side in the IC. The simulation sub-grid physics parameters were set by specifically matching the cosmic star formation history (CSFH) with various observations. The detailed information about models of gas cooling and heating, AGN and supernova (SN) feedback, star formation, and chemistry are given in Lee et al. (2021). The galaxies in HR5 were identified from the entire snapshots of HR5 using the physically self-bound (PSB)-based galaxy finder, PGalF (Kim et al. 2023). PGalF uses the stellar density map to identify star particle groups (substructures or galaxies).
The strength of the HR5 simulation lies in the fact that it is able to capture physical processes on scales ranging from gigaparsec down to kiloparsec scales with a dynamic range an order of magnitude higher than any previous simulations of this kind. Figure 1 demonstrates the importance of using a simulation box larger than 1 cGpc. Plotted are the velocity two-point correlation functions (VCF) calculated from the Fourier transformation of the power spectrum P(k)/k2, integrated over the ranges covered in the initial conditions of recent simulations such as Horizon Run 4 (green; 3150 h−1Mpc; Kim et al. 2015), HR5 (red; 717.2 h−1Mpc), Illustris TNG300 (brown; 205 h−1Mpc), TNG100 (violet; 75 h−1Mpc), and TNG50 (pink; 35 h−1Mpc; Nelson et al. 2019). It is related with the pairwise peculiar velocity v12(r) by ξv(r) = ξv(0)−⟨v122⟩/2. The black line in the upper panel is the correct VCF when the full spectral range is covered, and the VCFs relative to the correct one endowed in the initial conditions of various simulations are shown in the bottom panel. It can be seen that the velocity dispersion, or the VCF at zero separation, is significantly underestimated when the simulation box size is smaller than 1 cGpc. This may be one of the reasons why the galaxy velocity dispersion is on average lower in TNG50 compared to that in TNG100 at a fixed galaxy mass even though TNG50 has a higher force resolution than TNG100. The same is true between TNG100 and TNG300. At the galaxy (∼1 cMpc) and cluster (∼10 cMpc) scales, the VCF is even more underestimated, and it is hard to anticipate a correct calculation of the internal kinematic evolution of galaxies and clusters in the simulations with box size much smaller than 1 cGpc as mergers and accretion are not accurately simulated.
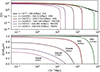 |
Fig. 1. Comparison of VCF for the various cosmological hydrodynamical simulations highlighting the importance of larger simulation box size. It can be seen that the VCF is significantly underestimated at zero separation (velocity dispersion), galaxy scale (r ≈ 1 h−1 Mpc) and cluster scale (r ≈ 10 h−1 Mpc) when the simulation size is less than 1cGpc |
Another critical benefit of using HR5 is that it allows us to examine the FP at high redshifts. Due to its large volume, a significant number of galaxies have already formed by z = 6, and about 15% of them have a spheroidal morphology (Park et al. 2022). This allows us to study the FP of spheroids at least up to z = 6. However, it should also be pointed out that the force resolution of HR5 is about 1 pkpc and the half mass radius of small galaxies could have been systematically affected. Therefore, we aim to study the emergence of the FP and relative evolution of the FP parameters rather than their absolute values.
2.2. Sample selection
In this section we outline our criteria for selecting the sub-sample of galaxies from the HR5 simulation for our FP study. Initially, we applied a threshold on the galaxy stellar mass, considering only central galaxies with stellar mass M* > 2 × 10⁹ M⊙ or 1,000 stellar particles, to securely estimate the internal structure of galaxies and to reduce the potential impact of the limited resolution of the simulation.
Following the methodology of Park et al. (2022), we further classified the galaxy morphology based on the asymmetry parameter and the radial profile of their stellar mass density distribution. We utilized a non-parametric morphological descriptor, the asymmetry parameter (A), to distinguish between symmetric and asymmetric galaxies. Park et al. (2022) observed a dichotomy in A at approximately A = 0.4 to 0.5 for galaxies with a relatively high stellar mass. Accordingly, galaxies with A ≥ 0.4 are deemed to be asymmetric, while those with (A < 0.4) are considered symmetric.
Subsequently, the target sample was refined by fitting the radial profile of each galaxy’s stellar mass density projected on the galactic plane with a Sérsic profile, allowing us to derive the best-fit Sérsic index value, nSérsic. The regular galaxies with A < 0.4, 1.5 < nSérsic < 100 are classified as spheroids, and those with 0 < nSérsic < 1.5 are called the disc galaxies. The value of the nSérsic = 1.5 chosen to classify galaxies into two broad morphology classes is based on the distribution of the Sérsic index of SDSS galaxies (Park & Choi 2005). The radial range over which the stellar mass-density profile was computed was constrained by physical and numerical considerations. R90, containing 90% of total galaxy stellar mass, is the outer limit of the radial range where the mass-density profile was calculated and used to estimate the Sérsic index. The 10% of stellar particles at the outermost region were dropped to minimize the mass contribution from possible stray galaxies and the tidal disruption effects of neighboring systems. On the other hand, the inner limit was set to r = 0.8 pkpc, taking into account the force resolution of HR5 and to avoid fitting galaxy cores. The above galaxy morphology classification criteria reproduce the fraction of discs, spheroids, and irregular galaxies as a function of stellar mass and redshift, which is in close agreement with the observational results from JWST (Lee et al. 2024).
The lowest redshift considered in our study is z = 0.625, which corresponds to the final snapshot available from the HR5 simulation that evolves from z = 200 down to z = 0.625. In Fig. 2, we present key properties such as the half stellar mass radius (Rhsm), SDSS (g − r) colour, SDSS r-band age (ager), and Sérsic index (nSérsic) versus stellar mass (M*) for our sample selected at z = 0.625. The blue points represent the spheroids sample with M * > 2 × 10⁹ M⊙, while the orange points show the distribution of the spheroid sub-sample with M * > 1011 M⊙. Tables 1 and 2 summarize the number of spheroids in each sub-sample at each redshift analysed in our analysis. In addition to the morphology-based samples, we also constructed sub-samples using an additional criterion of Vrot/σe < 0.55 to identify slow rotators, thereby examining the impact of internal kinematics on the FP coefficients. This threshold is consistent with previous studies (Chisari et al. 2015; Rosito et al. 2021) and, in our case, also corresponds to the median Vrot/σe value measured for HR5 galaxies as a function of stellar mass. The rotational velocity, Vrot, is the mass weighted tangential velocity of stellar particles inside the 3D stellar half mass radius in cylindrical co-ordinates. The velocity dispersion, σe, is defined as  , where σR, σrot, and σz represent the velocity dispersion in the radial, tangential, and vertical directions, respectively.
Fundamental plane coefficients for the massive spheroidal galaxy sub-sample (M* > 1 × 10¹¹ M⊙).
Fundamental plane coefficients for all spheroidal galaxies with M* > 2 × 10⁹ M⊙.
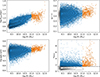 |
Fig. 2. Distribution of 3D half stellar mass radius (log Rhsm), SDSS (g − r) colour, stellar age in r band (log ager), and Sérsic index (nSérsic) versus stellar mass (log M*) for selected spheroidal galaxies (blue points), their massive sub-sample ( |


3. FP fitting
The observed FP relation is given by
 (1)
(1)
where Re is the effective radius, σe is the 1D line of sight velocity dispersion measured from the galaxy spectra, and ⟨Ie⟩ is the mean surface brightness within Re defined as Ie = Le/2πRe2.
To resolve the contribution of the stellar population, the SM-FP can be measured by replacing the luminosity term in the above L-FP with stellar mass, such that
 (2)
(2)
where Σe = M*/(2πRhsm2) is the mean stellar mass density, with M* being the total stellar mass within the half-stellar-mass radius, Rhsm (measured in solar masses), σe the mass-weighted root-mean-square velocity of all stellar particles within Rhsm calculated along a given line of sight (z axis, measured in kilometres per second), and Rhsm is the 3D half stellar mass radius (measured in kiloparsecs). We then used the LTS-Plane fit (Rousseeuw & Van Driessen 2006; Cappellari et al. 2013) method to perform mass FP plane fitting on our galaxies at various redshifts. This method uses the least-squares fitting algorithm and also trims away outliers that contribute most to the residuals. For each analysed redshift, we estimated the parameters defined in the Eq. (2) for spheroids in our sample.
To estimate the uncertainties of the FP coefficients, we adopted two independent methods. In the first approach, we generated 40 bootstrap resamples, each with the same size as the original dataset, and adopted the standard deviation of the fitted FP coefficients across these resamples as the parameter uncertainties. In the second approach, we divided the sample at each redshift into n = 10 sub-samples of equal size, fitted the FP independently to each, and calculated the standard deviation of the resulting coefficients. This procedure was repeated ten times, and the average of the standard deviations was taken as the final uncertainty estimate. A comparison of the two approaches shows that the bootstrap errors are systematically smaller than those from sub-sampling, indicating that bootstrapping tends to underestimate the true uncertainties in the FP coefficients. Nevertheless, we report results from both methods and specify which one is adopted in each case. We present our results in the next section.
4. Results
We now present the best fitting FP parameters, b and c, its zero point, a, as well as the scatter, Δ, and relative scatter, Δ/Δr, which can be calculated as
 (3)
(3)
where N is the total number of selected galaxies at each redshift, and Rmax and Rmin mark the range of Rhsm that contains 95% of the total sample of galaxies computed using 2.5 and 97.5 percentile values, respectively. We chose Δr to estimate the range in log Rhsm instead of more commonly used σR, which is the RMS value. Our choice of Δr was motivated by the following reasons: (i) it directly quantifies the extent of galaxy size distribution in the sample, offering a clearer picture of the structural diversity, and (ii) it is less sensitive to outliers or to the strongly skewed distribution of galaxy radii, whereas σR undesirably decreases when small-size galaxies dominate the sample.
4.1. Stellar mass fundamental plane: Massive spheroids with M* > 1 × 10¹¹ M⊙
We present in the left panel of Fig. 3 the redshift evolution of the FP of spheroidal galaxies with stellar masses of M* > 1011 M⊙ across various redshifts. The simulated FPs are well defined, exhibiting a relatively low scatter at all redshifts up to z ≃ 2.5. We observe a shift in the FPs towards the right as the redshift decreases, indicating the increasing size evolution of galaxies over cosmic time. Numerous studies have shown that at a fixed stellar mass, spheroid-like galaxies were significantly more compact at higher redshifts (z ∼ 1 − 2) than their likely present-day descendants (Daddi et al. 2005; Longhetti et al. 2007; Trujillo et al. 2007; Buitrago et al. 2008; Stockmann et al. 2019, 2021). The drivers of spheroid galaxy size evolution in our simulations will be explored in a separate paper.
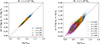 |
Fig. 3. Redshift evolution of SM-FP for the spheroidal galaxies in HR5. Note that galaxies are located along the diagonal line as the best-fit FP coefficients are used at each redshift. The relation moves to the right as galaxies grow in size with time. Left: For the massive sub-sample with M* > 1 × 10¹¹ M⊙Right: For the sample with M* > 2 × 10⁹ M⊙. To mitigate the overlap of points, black contours are plotted for the initial five redshifts, representing the central 90% of galaxies contained within. |
Table 1 summarizes the FP slope parameters, b and c, the zero point, a, the absolute scatter, Δ, and the relative scatter, Δ/Δr, for the massive galaxies. The error bars in this case were obtained using bootstrap resampling method as is described in Sect. 3 because of small sample sizes.
To examine the evolution of the FP slope parameters, and to facilitate comparisons with other simulations and observational studies, we present in Fig. 4, the redshift dependence of coefficients, b (upper panel) and c (middle panel). We find that in the case of our massive sub-sample, the overall magnitude of the coefficient, c, represented by the solid red curve is smaller than the Horizon-AGN (Rosito et al. 2021) result represented by the dashed green curve, at all redshifts. However, both simulations predict a weak (possibly decreasing) dependence of |c| towards higher redshifts. It should be pointed out that the sample selection criteria for the FP study are different in different simulations, and hence we do not expect to see an accurate quantitative agreement among the simulated results. The Horizon-AGN study (Rosito et al. 2021) distinguishes slow rotators from fast rotators, using Vrot/σe to classify them into early or late types, respectively, and follows Chisari et al. (2015) in adopting Vrot/σe < 0.55 to select a slowly rotating galaxy sample. In contrast, our methodology selects spheroidal galaxies based directly on their morphology using structural parameters, including the asymmetry parameter and the Sérsic index. These differing selection criteria may introduce systematic differences in the galaxy populations analysed, thereby influencing the quantitative comparison of FP parameter evolution between simulations.
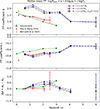 |
Fig. 4. Redshift evolution of the SM-FP parameters: slope coefficients, b (top) and c (middle), and zero-point variation, Δa = az − azi (bottom). The results of the HR5 samples are indicated by a red curve for the massive sub-sample and a blue curve for the full sample. The errors on a, b, c, Δ, and Δ/Δr were estimated using bootstrap resampling for the massive sub-sample, while for the broader sample that includes lower-mass galaxies, they were determined with the sub-sampling method. Observational constraints from Hou & Wang (2016) and Bernardi et al. (2020) are shown as magenta and yellow points, respectively. |
On the other hand, the magnitude and redshift evolution of coefficient b agrees quite well with the Horizon-AGN predicted evolution. An interesting finding is that both simulations predict a weak dependence of b on redshift in the sense that b monotonically decreases toward higher redshifts. We show below that this trend of the b coefficient is still true for less massive galaxies but with a different magnitude of b. This indicates that the coefficient b reflects galaxy evolution more sensitively than c. Similarly, the FP zero point offset defined as Δa = az − azi, represented by the solid red curve in the bottom panel of Fig. 4, tracks the FP zero-point shift, isolating any structural or dynamical changes at fixed σe and Σe. We find negligible evolution of Δa, suggesting early structural maturity for the massive galaxies. Another interesting property of the FP is its tightness (i.e., the amount of scatter of galaxies around the plane). It is related to questions such as how early an FP forms, and how its tightness evolves with cosmic time sheds light on galaxy-evolution processes. We calculated the absolute scatter, Δ, to quantify the strength of the FP and the relative scatter, Δ/Δr, to quantify the existence of the FP. We note from Table 1 that both Δ and Δr remain low at all analysed redshifts, indicating the existence of a well-defined FP at z ≃ 2.5 (see the left panel of Fig. 3). This in turn suggests that massive galaxies were already structurally mature and dynamically settled at this epoch, so that the FP was established very quickly in cosmic history.
The FP parameters measured for observed galaxies are too scarce for a direct comparison with simulations, especially at redshifts higher than z ∼ 1. Additionally, the comparison is also impacted by the fact that the observational results have used the ETG samples selected using different criteria. For instance, in a FP study based on SDSS DR7 galaxies at z < 0.2 (Hou & Wang 2015), the ETGs were selected based on multiple criteria, i.e. (a) the concentration index r50/r90 > 2.5, (b) the ratio of the likelihood of the de Vaucouleurs model to the exponential model LdeV/Lexp ≥ 1.03, and (c) a spectral classification index eClass of less than −0.1.
4.2. Stellar mass fundamental plane: Spheroids with M* > 2 × 10⁹ M⊙
Our full sample contains the spheroidal HR5 galaxies with M* > 2 × 10⁹ M⊙. The right panel of Fig. 3 shows that the FP remains well defined across all redshifts, from z = 0.625 up to z = 6, with a scatter that is moderate but larger than that of massive ones. At z ∼ 6, most galaxies have M* < 1 × 10¹⁰ M⊙, and only about 15% of them have a spheroidal morphology. These spheroidal galaxies tend to undergo morphological transformation back to disc types as the large-scale tidal torques set up in the primordial density fluctuations continue to inject angular momentum via subsequent mergers and accretion (Park et al. 2022). Even though the spheroidal morphology of these galaxies is incidental and temporary, we find that the spheroidal galaxies at high redshifts still lie on a well-defined FP. Therefore, the right panel highlights the robustness of the FP across a wide mass range. It shows how galaxy formation and evolution processes leave a clear imprint on the FP even at the earliest cosmic epochs.
Although the FP is already established by z ∼ 6, its normalization still shifts as galaxies grow. As redshift decreases, the FP shifts towards larger log R, indicating an overall increase in galaxy size over cosmic time, consistent with observations that galaxies tend to grow larger at later epochs. In Table 2, we summarize the FP coefficients, a, b, and c, the absolute scatter, Δ, and the relative scatter, Δ/Δr, across a range of redshifts, extending up to z ∼ 6. The uncertainties on each coefficient were estimated in the manner described in Sect. 3.
In Fig. 4, the blue curve represents the redshift evolution of the FP coefficients b and c, as well as the zero-point offset, Δa, for this broader galaxy sample. The magnitude of c in this case agrees (within uncertainties) with the value measured for massive galaxies (M* > 1011 M⊙) up to z ∼ 2, though |c| remains larger than the Horizon-AGN prediction. Also, there is an indication of a decrease towards high redshifts beyond z > 1.2. Similarly to the massive ones, b decreases gradually as redshift increases, but its value is larger than in the HR5 massive sub-sample or the Horizon-AGN slow rotator track. Meanwhile, Δa, the FP zero-point offset, increases with redshift up to z ≈ 2, then decreases at higher z. This trend likely results from structural evolution at fixed σe and Σe, as well as from changes in the dynamical-to-stellar mass ratio (e.g. an evolving dark-matter fraction).
To further refine our sample, we examined the kinematics of the morphologically selected spheroids (A < 0.4, ns > 1.5) and found that about 50% of them are highly dispersion-dominated (Vrot/σe < 0.55). We applied this additional kinematic selection to isolate dispersion-dominated spheroids. This criterion yields a subset of spheroids with a tighter FP, with the relative scatter decreasing by about 10–15% across the redshift range. The FP coefficients shift only slightly, bringing them closer to those of the massive galaxy sub-sample, as is indicated by black curves in each panel of Fig. 4. The overall redshift evolution of the FP coefficients remains qualitatively similar after applying this additional selection criterion.
5. Discussion
In the previous section, we reported the existence of the FP for spheroidal galaxies in the HR5 simulation at redshifts beyond 3 and as high as z ∼ 6. To our knowledge, no previous galaxy simulations or observations have explored the FP at such early cosmic epochs. Both the absolute scatter (Δ) and the relative scatter (Δ/Δr) remain low even at high redshifts, as is summarized in Table 2. The finding that the mass–FP is already well established by z ∼ 6 is striking, since galaxies at these epochs are still actively forming and undergoing frequent mergers. However, it should be noted that most galaxies have M* < 1010 M⊙ at high redshifts of z ∼ 6, and there are essentially no AGN activities or rapid star formation quenching active in HR5 simulation at these epochs. The existence of FP therefore reflects the internal dynamical stability of the stellar components of galaxies. A natural explanation lies in the processes that rapidly drive spheroidal systems towards equilibrium. In particular, violent relaxation during major mergers efficiently erases the memory of progenitor orbits and establishes virialized systems whose global properties are largely independent of the detailed merger history. At high redshift, dissipative (gas-rich) mergers further promote compact remnants, thereby tightening the scaling relations.
5.1. Reasons for studying the stellar mass FP instead of the luminosity FP
The conventional luminosity FP has long been used as a tool to study ETG evolution. However, the L-FP is sensitive to variations in stellar populations, dust attenuation, and observational wavelength (Scodeggio et al. 1998; La Barbera et al. 2008; Hyde & Bernardi 2009). This becomes especially problematic at high redshifts, where the spectral energy distribution of galaxies evolves rapidly, and even the rest-frame luminosity at a particular band does not reliably trace the underlying stellar mass distribution after the cosmological band-shift correction is made. To mitigate these biases, we instead focus on the SM-FP, replacing surface brightness, Ie, with the stellar mass surface density, Σe. This allows us to isolate structural and dynamical properties independently of the spectral energy distribution and contamination from dust. As is shown in Appendix A, the r-band luminosity becomes an increasingly poor tracer of stellar mass at z ≥ 1, whereas the SM-FP remains robust out to z ∼ 6. This mass-based approach provides a more direct probe of the underlying dynamically relaxed baryonic mass component and yields a more physically interpretable FP.
5.2. Mass dependence of FP parameters
Our analysis reveals a strong mass dependence in the FP slope, b, and in its zero-point offset, Δa, as is shown in Fig. 4 and Tables 1 and 2. First, the coefficient b is about 60% larger for the whole sample compared to that of the massive subset. Nevertheless, its redshift evolution does not seem to depend on mass, as both samples show a decreasing trend with redshift for b with similar slopes. On the other hand, the zero point offset, Δa, shows a strong dependence on mass in both its magnitude and evolution rate, as is shown in the bottom panel of Fig. 4. Interestingly, we find much less dependence of c on stellar mass over the common redshift range explored for the two mass samples.
5.3. Nature of the FP scatter
In addition to slope parameters, we find that the FP scatter in HR5 remains low (Δ ∼ 0.05 − 0.07 dex) for the whole sample and as well as (∼0.03 dex) for the massive sample, even at high redshifts, suggesting an early emergence of a well-defined mass–plane relation. This tightness is consistent with the small scatter (∼0.06 dex) found in the Horizon-AGN FP study up to z ∼ 3, although HR5 uniquely extends the FP analysis up to z ∼ 6, where such tight scaling relations have not previously been reported.
To study the nature of FP scatter, we examined the distribution of the stellar age, Vrot/σe ratio, and sSFR of galaxies along the FP (see Fig. 5). These properties are often used to select galaxy samples for an FP analysis. For instance, Lu et al. (2020) used the sSFR to select the quenched galaxies for the FP study in the Illustris-TNG simulation, while Rosito et al. (2021) used the Vrot/σe ratio to isolate slow rotators in the Horizon-AGN simulation. In both cases, the selected galaxies are broadly called the ‘early-type’ galaxies. In our study, we adopted the morphology of galaxy stellar mass distribution to select spheroidals for the FP analysis.
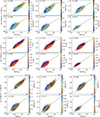 |
Fig. 5. Redshift evolution of SM-FP for the spheroidal galaxies in HR5. The symbols are coloured according to the mass-weighted average stellar age (upper panels), Vrot/σe (middle panels), and sSFR = SFR/M*[yr−1] (bottom panel). The 1:1 line is depicted in black in each panel. |
At z ∼ 1, Fig. 5 shows a noticeable age gradient along the FP, with galaxies having older stellar populations systematically located towards larger effective radii and lying mostly above the 1 : 1 relation. Beyond z ≈ 4, this trend is reversed, with relatively older galaxies migrating below the 1 : 1 line and to smaller radii. This interesting transition happens starting from the cosmic noon period between z ∼ 4 and 1.5. A similar trend is visible in the sSFR shown in the bottom panels of Fig. 5, where the galaxies with a relatively low sSFR show a very similar behaviour. We have also found a similar trend along the FP for the stellar mass-to-light ratio (M*/L). This is because older galaxies exhibit a systematically higher M*/L ratio. These findings agree with the trends observed in the Horizon-AGN (Rosito et al. 2021) study, where AGN feedback was shown to drive older stellar ages and tighter FP relations.
The distribution of the age, sSFR, and M*/L ratio along the FP indicates that galaxies are not cleanly separated by these properties. At z > 3, a subset of relatively passive or older galaxies defines a much tighter FP than the full sample. However, at z ≲ 3, a restriction in these parameters results in nontrivial evolution of the subset along the FP, and does not reduce its overall scatter. This implies that the age, sSFR, and M*/L ratio are not the fundamental physical drivers of the FP.
On the other hand, the middle panels of Fig. 5 clearly show a systematic dependence of FP tightness on Vrot/σe. At all redshifts, slow rotators define a tighter FP compared to the whole sample and lie above the 1 : 1 relation. Below z ∼ 2, however, this distinction weakens as the slow rotator population loses some of its smaller members. This indicates that it is the Vrot/σe parameter that better selects the tighter FP galaxies compared to the star formation activity indicators. Constraining our sample of all spheroidal-type galaxies with M* > 2 × 10⁹ M⊙ to those with Vrot/σe < 0.55 results in a tighter FP with a smaller Δ (higher strength of FP), closer to that of the massive sample, as can be seen by the black curves in Fig. 4.
5.4. Comparison with other studies
Here, we compare our SM-FP results with predictions from other cosmological hydrodynamical simulations and some observational studies. While differences in sample selection and physical models prevent a one-to-one quantitative comparison, several key trends emerge.
For both HR5 and Horizon-AGN simulations, the magnitude of the FP coefficient, |c|, which quantifies the dependence on the stellar mass surface density, Σe, shows a mild decrease with redshift. The coefficient b, representing the dependence on the velocity dispersion, σe, exhibits a redshift evolution in both HR5 and Horizon AGN. For the HR5 full sample (including lower-mass galaxies), b decreases steadily from ∼2.1 at z ∼ 0.625 to below 1.0 at z ∼ 4 to 6, indicating a shallower relation between galaxy size and velocity dispersion at early times. This trend is consistent with the Horizon-AGN results, though the whole sample of HR5 galaxies with M* > 2 × 10⁹ M⊙ tends to show higher b values at fixed redshift. For the massive sub-sample with M* > 1011 M⊙, the b values from HR5 are much closer to Horizon AGN results. Additional insights come from the Magneticum Pathfinder simulations (Dolag et al. 2025), which examined the SM-FP from z∼4 to z = 0. They find nearly constant slopes, a steadily increasing zero point towards higher redshift, and a constant intrinsic scatter of ∼0.06 dex in log Re, despite strong size and surface density evolution. While differing observable definitions hinder a direct numerical comparison, both HR5 and Magneticum simulations show a tight SM-FP up to high redshift, with the evolution driven mainly by zero-point shifts rather than slope changes. The two observational studies (Hou & Wang 2016; Bernardi et al. 2020) of the SM-FP plotted in Fig. 4 are both at redshifts lower than the lowest HR5 snapshot (z = 0.625). A direct comparison with our results is therefore not possible, but they provide useful context for the FP at low redshift. Looking forwards, with the advent of JWST (NIRSpec/NIRCam; Jakobsen et al. 2022; Rieke et al. 2005) and large ground-based facilities such as Gemini/FLAMINGOS-2 (Eikenberry et al. 2006), it will become possible to measure high signal-to-noise velocity dispersions and structural parameters for galaxies at z > 2. These datasets will provide a critical test of our prediction that a tight SM-FP is already in place by z ∼ 6.
In Appendix A we also present the redshift evolution of the L-FP to compare with our SM-FP results. Figure A.1 illustrates the evolution of the L-FP coefficients b and c, as well as the zero-point offset, Δa, for both the massive galaxy sub-sample and the broader sample. We find that, consistent with previous simulation studies, the coefficient c exhibits negligible redshift dependence across all samples, while the coefficient b shows a systematic decrease with increasing redshift, indicating sensitivity to structural evolution. Observational results from van Dokkum & Franx (1996), Saglia et al. (2010), Hou & Wang (2015), and Stockmann et al. (2021) are also included for comparison. While these lie broadly within the simulation predictions at low redshift, the scarcity of high-redshift data limits a direct comparison beyond z ∼ 2.5. The zero-point offset, Δa, remains nearly flat for the massive galaxies, suggesting early structural maturity. In contrast, the lower-mass sample shows a pronounced increase in Δa up to z ∼ 2.5, followed by a decline, possibly reflecting transitions in the dominant physical processes such as mergers or evolving mass-to-light ratios. In Fig. 6, we compare the SM-FP (solid lines) with the corresponding L-FP (dashed lines). The differences are evident. For the coefficient c, the SM-FP evolves gradually and already approaches the theoretical virial expectation value of −1 by z ∼ 2, whereas the L-FP shows a stronger offset and slower convergence. A similar contrast is seen in the zero-point offset, Δa: the SM-FP evolves smoothly with a modest rise, while the L-FP exhibits a much larger variation, before declining towards zero at lower redshift. For the coefficient b, the SM-FP increases steadily and reaches higher values at z > 2, converging on the virial expectation of b ≈ 2. Although the SM-FP coefficients (b and c) vary more strongly with redshift than those of the L-FP, their evolution follows a clear, physically consistent trend towards the virial expectations (b ≈ 2, c ≈ –1). In contrast, the L-FP evolves more slowly and remains systematically offset from these values. This indicates that the SM-FP traces the structural and dynamical evolution of galaxies more coherently, whereas the L-FP retains the imprint of stellar population evolution.
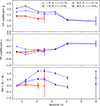 |
Fig. 6. Comparison between the L-FP and the SM-FP as a function of redshift. The panels show the evolution of FP coefficients b (top) and c (middle), and the zero-point offset, Δa = az − azi (bottom). Results are shown for two stellar mass-selected samples: a massive sub-sample with M* > 1 × 10¹¹ M⊙ (red) and the full sample with M* > 2 × 10⁹ M⊙ (blue). Solid lines correspond to the SM-FP, while dashed lines indicate the L-FP. |
6. Conclusions
We have investigated the FP of the spheroidal morphological type galaxies at redshifts up to z = 6, using the Horizon Run 5 simulation, which captures the initial density fluctuation modes up to ∼1cGpc. Thanks to its unprecedented large dynamic range from the gigaparsec scale to the scale of ∼1 proper kpc, HR5 allows us to identify a significant number of galaxies with M* > 1 × 10⁹ M⊙, even at redshift 6 and greater.
To examine the redshift evolution of the FP, in each HR5 snapshot we selected a subset of galaxies satisfying the following two conditions: (i) being the central galaxy, and (ii) having a spheroidal morphology (nSérsic > 1.5, where nSérsic is the Sérsic index of the stellar mass density profile at distances larger than 0.8 pkpc from the galaxy centre). It should be noted that we selected galaxies solely by their morphology and did not require them to be quiescent based on their colour or sSFR-properties that do not necessarily correlate with morphology or internal kinematics, particularly at early cosmic epochs. As the relations between the star formation rate, internal kinematics, and morphology evolve with time and the well-known tight relations are merely those near the present epoch, one should not use one of these properties as a proxy of the other at high redshifts Park et al. (2022).
In this study, we find that the FP relation was already well established at z ≈ 6, with a small scatter. Additionally, we find that the coefficient b of the log σe term exhibits a systematic decreasing trend with increasing redshift. The magnitude of the coefficient c of the Σe term shows a similar systematic decrease. These trends reflect the evolving structural and dynamical properties of spheroidal galaxies over cosmic time. The absolute values of the FP coefficients seem to depend on galaxy mass. Coefficient b is smaller for more massive galaxies with M* > 1011 M⊙, compared to a broader sample of galaxies with M* > 2 × 10⁹ M⊙, while the two samples have similar values of coefficient c. Different simulations tend to give different absolute values of the coefficients, but interestingly predict more or less the same redshift dependence. That is, all simulations predict decreasing evolution of the magnitudes of b and |c| as redshift increases. On the other hand, a direct comparison with observations remains challenging due to differences in sample selection criteria and the limited availability of data at z > 2.
Our main findings are summarized as follows:
-
A well-defined SM-FP exists as early as z ∼ 6, with a low intrinsic scatter (Δ ≲ 0.07 dex), indicating that the dynamical and structural correlations of spheroidal morphological-type galaxies and slowly rotating galaxies were already established in the first billion years of cosmic history.
-
We find a mass-dependence of the FP coefficients. Coefficient b, representing the velocity dispersion term, is smaller for relatively massive galaxies with M* > 1011 M⊙ compared to those for galaxies with M* > 2 × 10⁹ M⊙. The zero point, a, shows almost no evolution for the massive ones, while the smaller mass galaxies show non-monotonic evolution in a. In contrast, the coefficient c, tied to the stellar surface mass density, shows nearly no mass dependence.
-
The magnitudes of b (positive) and c (negative) show a roughly monotonic decreasing trend with redshift, while a for relatively low-mass galaxies increases up to z ≈ 2 and decreases above that.
-
Comparisons with other simulations, including Horizon-AGN and IllustrisTNG, show broad agreement in the redshift trends of FP coefficients, despite differences in galaxy selection criteria. HR5 uniquely enables the study of the FP at z > 2.5, where observational constraints are currently limited.
-
An analysis of FP residuals reveals systematic trends with the stellar age, Vrot/σe ratio, and sSFR (and also mass-to-light ratio), supporting the interpretation that stellar population properties influence the FP zero point and scatter, even in mass-based scaling relations. Among the parameters, Vrot/σe reduces the FP scatter at all redshifts.
The early emergence and persistence of the SM-FP can provide key constraints for galaxy formation models and motivate high-redshift spectroscopic observations with JWST and ground-based facilities such as Gemini to test these predictions.
Acknowledgments
PG and CP are supported by KIAS Individual Grant (PG088101, PG016903) at Korea Institute for Advanced Study (KIAS). CP is also supported by the National Research Foundation of Korea (NRF) grant funded by the Korean government (MSIT; RS-2024-00360385). J.L. is supported by the National Research Foundation (NRF) of Korea grant funded by the Korea government (MSIT, RS-2021-NR061998). S.E.H. is partly supported by the Korea Astronomy and Space Science Institute grant funded by the Korean government (MSIT; No.2024186901) and the grant funded by the Ministry of Science (No. 1711193044). This work benefited from the outstanding support provided by the KISTI National Supercomputing Center and its Nurion Supercomputer through the Grand Challenge Program (KSC-2018-CHA-0003, KSC-2019-CHA-0002). It was also supported by the Supercomputing Center/Korea Institute of Science and Technology Information, with supercomputing resources including technical support (KSC-2013-G2-003), and the simulation data were transferred through a high-speed network provided by KREONET/GLORIAD. This work also made use of computing resources at the Center for Advanced Computation at Korea Institute for Advanced Study. Software: AstroPy (Astropy Collaboration 2022), Matplotlib (Hunter 2007), Pandas (The pandas development team 2020; McKinney 2010), Seaborn (Waskom 2021).
References
- Astropy Collaboration (Price-Whelan, A. M., et al.) 2022, ApJ, 935, 167 [NASA ADS] [CrossRef] [Google Scholar]
- Belli, S., Newman, A. B., & Ellis, R. S. 2017, ApJ, 834, 18 [Google Scholar]
- Bernardi, M., Domínguez Sánchez, H., Margalef-Bentabol, B., Nikakhtar, F., & Sheth, R. K. 2020, MNRAS, 494, 5148 [Google Scholar]
- Bezanson, R., van Dokkum, P. G., van de Sande, J., et al. 2013, ApJ, 779, L21 [NASA ADS] [CrossRef] [Google Scholar]
- Binney, J., & Tremaine, S. 2011, Galactic Dynamics: Second Edition, Princeton Series in Astrophysics (Princeton, NJ: Princeton University Press) [Google Scholar]
- Buitrago, F., Trujillo, I., Conselice, C. J., et al. 2008, ApJ, 687, L61 [Google Scholar]
- Cappellari, M., Scott, N., Alatalo, K., et al. 2013, MNRAS, 432, 1709 [Google Scholar]
- Chisari, N., Codis, S., Laigle, C., et al. 2015, MNRAS, 454, 2736 [NASA ADS] [CrossRef] [Google Scholar]
- Correa, C. A., Schaye, J., Clauwens, B., et al. 2017, MNRAS, 472, L45 [Google Scholar]
- Crain, R. A., Schaye, J., Bower, R. G., et al. 2015, MNRAS, 450, 1937 [NASA ADS] [CrossRef] [Google Scholar]
- Daddi, E., Renzini, A., Pirzkal, N., et al. 2005, ApJ, 626, 680 [NASA ADS] [CrossRef] [Google Scholar]
- Djorgovski, S., & Davis, M. 1987, ApJ, 313, 59 [Google Scholar]
- Dolag, K., Remus, R. S., Valenzuela, L. M., et al. 2025, ArXiv e-prints [arXiv:2504.01061] [Google Scholar]
- D’Onofrio, M., & Chiosi, C. 2024, A&A, 687, A126 [NASA ADS] [CrossRef] [EDP Sciences] [Google Scholar]
- Dressler, A., Lynden-Bell, D., Burstein, D., et al. 1987, ApJ, 313, 42 [Google Scholar]
- Dubois, Y., Pichon, C., Welker, C., et al. 2014, MNRAS, 444, 1453 [Google Scholar]
- Dubois, Y., Peirani, S., Pichon, C., et al. 2016, MNRAS, 463, 3948 [Google Scholar]
- Eikenberry, S., Elston, R., Raines, S. N., et al. 2006, Proc. SPIE, 6269, 626917 [Google Scholar]
- Genel, S., Nelson, D., Pillepich, A., et al. 2018, MNRAS, 474, 3976 [Google Scholar]
- Guillet, T., & Teyssier, R. 2011, J. Comput. Phys., 230, 4756 [Google Scholar]
- Hahn, O., & Abel, T. 2011, MNRAS, 415, 2101 [Google Scholar]
- Hirschmann, M., Dolag, K., Saro, A., et al. 2014, MNRAS, 442, 2304 [Google Scholar]
- Hou, L., & Wang, Y. 2015, Res. Astron. Astrophys., 15, 651 [Google Scholar]
- Hou, L., & Wang, Y. 2016, A&A, 588, A39 [NASA ADS] [CrossRef] [EDP Sciences] [Google Scholar]
- Hunter, J. D. 2007, Comput. Sci. Eng., 9, 90 [NASA ADS] [CrossRef] [Google Scholar]
- Hyde, J. B., & Bernardi, M. 2009, MNRAS, 396, 1171 [NASA ADS] [CrossRef] [Google Scholar]
- Jakobsen, P., Ferruit, P., Alves de Oliveira, C., et al. 2022, A&A, 661, A80 [NASA ADS] [CrossRef] [EDP Sciences] [Google Scholar]
- Jenkins, A. 2010, MNRAS, 403, 1859 [NASA ADS] [CrossRef] [Google Scholar]
- Jørgensen, I., & Chiboucas, K. 2013, AJ, 145, 77 [CrossRef] [Google Scholar]
- Jørgensen, I., Franx, M., & Kjærgaard, P. 1996, MNRAS, 280, 167 [CrossRef] [Google Scholar]
- Kim, J., Park, C., L’Huillier, B., & Hong, S. E. 2015, J. Korean Astron. Soc., 48, 213 [Google Scholar]
- Kim, J., Lee, J., Laigle, C., et al. 2023, ApJ, 951, 137 [NASA ADS] [CrossRef] [Google Scholar]
- La Barbera, F., Busarello, G., Merluzzi, P., et al. 2008, ApJ, 689, 913 [NASA ADS] [CrossRef] [Google Scholar]
- Lee, J., Shin, J., Snaith, O. N., et al. 2021, ApJ, 908, 11 [CrossRef] [Google Scholar]
- Lee, J. H., Park, C., Hwang, H. S., & Kwon, M. 2024, ApJ, 966, 113 [NASA ADS] [CrossRef] [Google Scholar]
- Longhetti, M., Saracco, P., Severgnini, P., et al. 2007, MNRAS, 374, 614 [NASA ADS] [CrossRef] [Google Scholar]
- Lu, S., Xu, D., Wang, Y., et al. 2020, MNRAS, 492, 5930 [Google Scholar]
- Marinacci, F., Vogelsberger, M., Pakmor, R., et al. 2018, MNRAS, 480, 5113 [NASA ADS] [Google Scholar]
- McKinney, W. 2010, in Proceedings of the 9th Python in Science Conference, eds. S. van der Walt, & J. Millman, 56 [Google Scholar]
- Naiman, J. P., Pillepich, A., Springel, V., et al. 2018, MNRAS, 477, 1206 [Google Scholar]
- Nelson, D., Pillepich, A., Springel, V., et al. 2018, MNRAS, 475, 624 [Google Scholar]
- Nelson, D., Springel, V., Pillepich, A., et al. 2019, Comput. Astrophys. Cosmol., 6, 2 [Google Scholar]
- Park, C., & Choi, Y.-Y. 2005, ApJ, 635, L29 [NASA ADS] [CrossRef] [Google Scholar]
- Park, C., Lee, J., Kim, J., et al. 2022, ApJ, 937, 15 [NASA ADS] [CrossRef] [Google Scholar]
- Pillepich, A., Springel, V., Nelson, D., et al. 2018, MNRAS, 473, 4077 [Google Scholar]
- Planck Collaboration XIII. 2016, A&A, 594, A13 [NASA ADS] [CrossRef] [EDP Sciences] [Google Scholar]
- Rieke, M. J., Kelly, D., & Horner, S. 2005, Proc. SPIE, 5904, 1 [Google Scholar]
- Rodriguez-Gomez, V., Snyder, G. F., Lotz, J. M., et al. 2019, MNRAS, 483, 4140 [NASA ADS] [CrossRef] [Google Scholar]
- Rosito, M. S., Pedrosa, S. E., Tissera, P. B., et al. 2021, A&A, 652, A44 [NASA ADS] [CrossRef] [EDP Sciences] [Google Scholar]
- Rousseeuw, P. J., & Van Driessen, K. 2006, Data Min. Knowl. Discov., 12, 29 [CrossRef] [Google Scholar]
- Saglia, R. P., Sánchez-Blázquez, P., Bender, R., et al. 2010, A&A, 524, A6 [NASA ADS] [CrossRef] [EDP Sciences] [Google Scholar]
- Schaye, J., Crain, R. A., Bower, R. G., et al. 2015, MNRAS, 446, 521 [Google Scholar]
- Scoccimarro, R. 1998, MNRAS, 299, 1097 [NASA ADS] [CrossRef] [Google Scholar]
- Scodeggio, M., Gavazzi, G., Belsole, E., Pierini, D., & Boselli, A. 1998, MNRAS, 301, 1001 [Google Scholar]
- Snyder, G. F., Torrey, P., Lotz, J. M., et al. 2015, MNRAS, 454, 1886 [NASA ADS] [CrossRef] [Google Scholar]
- Springel, V., Pakmor, R., Pillepich, A., et al. 2018, MNRAS, 475, 676 [Google Scholar]
- Stockmann, M., Toft, S., Gallazzi, A., et al. 2019, ApJ, 888, 4 [NASA ADS] [CrossRef] [Google Scholar]
- Stockmann, M., Jørgensen, I., Toft, S., et al. 2021, ApJ, 908, 135 [Google Scholar]
- The pandas development team 2020, https://doi.org/10.5281/zenodo.3509134 [Google Scholar]
- Teklu, A. F., Remus, R.-S., Dolag, K., et al. 2015, ApJ, 812, 29 [Google Scholar]
- Teyssier, R. 2002, A&A, 385, 337 [CrossRef] [EDP Sciences] [Google Scholar]
- Toro, E. F., Spruce, M., & Speares, W. 1994, Shock Waves, 4, 25 [Google Scholar]
- Trujillo, I., Burkert, A., & Bell, E. F. 2004, ApJ, 600, L39 [Google Scholar]
- Trujillo, I., Conselice, C. J., Bundy, K., et al. 2007, MNRAS, 382, 109 [NASA ADS] [CrossRef] [Google Scholar]
- van de Sande, J., Kriek, M., Franx, M., et al. 2013, ApJ, 771, 85 [NASA ADS] [CrossRef] [Google Scholar]
- van de Sande, J., Kriek, M., Franx, M., Bezanson, R., & van Dokkum, P. G. 2014, ApJ, 793, L31 [Google Scholar]
- van Dokkum, P. G., & Franx, M. 1996, MNRAS, 281, 985 [NASA ADS] [CrossRef] [Google Scholar]
- Wang, Y., Vogelsberger, M., Xu, D., et al. 2020, MNRAS, 491, 5188 [Google Scholar]
- Waskom, M. L. 2021, J. Open Source Software, 6, 3021 [NASA ADS] [CrossRef] [Google Scholar]
Appendix A: Luminosity fundamental plane
We also investigate the conventional L-FP by adopting the following mathematical form:
![Mathematical equation: $$ \begin{aligned} \log \frac{R_{\rm hsm}}{[\mathrm{kpc} ]} = a + b \log \frac{\sigma _e}{[\mathrm {km s}^{-1} ]} +c\log \frac{I_e}{[L_{\odot }\mathrm {kpc}^{-2} ]}, \end{aligned} $$](/articles/aa/full_html/2025/12/aa57050-25/aa57050-25-eq7.gif) (A.1)
(A.1)
where again σe is the mass-weighted root-mean-square velocity of all stellar particles within Rhsm; Ie is the rest-frame r-band mean surface brightness of all stellar particles within Rhsm, defined as follows:
 (A.2)
(A.2)
where L is the rest-frame r-band luminosity of the galaxy projected within Rhsm. The r-band luminosity is not an ideal tracer of stellar mass especially at high redshifts no matter how the early-type population of galaxies are defined. This is due to its sensitivity to young, massive stars and dust attenuation.
A.1. Fundamental plane: Massive spheroids with M* > 1 × 10¹¹M⊙
We find the simulated L-FPs are well defined, exhibiting relatively low scatter at all redshifts.
In Fig. A.1 we present the redshift evolution of L-FP slope coefficients b (upper panel) and c (middle panel), as well as the zero-point offset (Δa = az − azi; bottom panel), with comparisons to other simulations and observational studies. We find that for our massive galaxy sub-sample the evolution of the coefficient c represented by the solid red line agrees well with the Illustris-TNG results (dashed pink line; Lu et al. 2020). In contrast, the Horizon-AGN simulation (dashed green curve; Rosito et al. 2021) predicts larger absolute values of c, deviating from the other two simulations. Despite these differences in magnitudes, all simulations suggest near redshift-independence of the coefficient c. On the other hand, all three simulations predict roughly the same value of the coefficient b up to z = 2, with only minor difference within statistical uncertainty. An interesting finding is that they all predict a weak dependence of b on redshift in the sense that b monotonically decreases toward higher redshift, indicating that coefficient b is more sensitive to evolutionary effects than coefficient c. Further in bottom panel of Fig. A.1, we find that Δa (solid red curve) remains relatively flat consistent with zero. This trend suggests that the structural and dynamical scaling relations of massive galaxies were already largely in place by z ∼ 2.5, with little subsequent evolution in the FP zero-point.
It is important to note that ETG selection criteria vary across simulations and different observational studies, which may explain some of the quantitative discrepancies. For example, in Illustris-TNG simulation a galaxy is classified as an early type if its radial surface-brightness profile is better fit by a de Vaucouleurs law than by an exponential profile, and if its sSFR lies at least 1 dex below the star-forming main-sequence ridge.
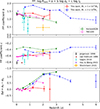 |
Fig. A.1. Redshift evolution of the L-FP coefficients, b (top), c (middle), and the zero-point offset, Δa = az − azi (bottom), where the L-FP is defined as log Rhsm = a + blog σe + clog Ie. Results from this work are shown for two stellar mass-selected samples: a massive sub-sample with M* > 1 × 10¹¹ M⊙ (solid red line) and the full sample with M* > 2 × 10⁹ M⊙ (blue dash-dotted line). For comparison, we also show L-FP results from other cosmological simulations (HorizonAGN: dashed green line; TNG100: dashed magenta line) and observational studies (Jørgensen et al. 1996; van Dokkum & Franx 1996; Saglia et al. 2010; Hou & Wang 2015; Stockmann et al. 2021). |
A.2. Fundamental plane: Slowly rotating spheroids with M* > 2 × 10⁹M⊙
We now turn to our analysis of a broader spheroidal galaxy sample with stellar masses M* > 2 × 10⁹ M⊙. Similar to the massive sub-sample, we find that the FP remains well-defined across all redshifts, from z = 0.625 up to z = 6, with relatively low scatter throughout. The evolution of the FP coefficients b and c for this lower-mass sample is shown in Fig. A.1 (blue curves). Compared to the massive galaxy sample, the lower-mass galaxies exhibit larger values of b and smaller absolute values of c, indicating mass dependence in the FP slopes. The coefficient c shows little evolution up to z ∼ 3 with an indication of rise up to z ∼ 6. In contrast, we do see a clear redshift evolution of the coefficient b for the broader galaxy sample. It decreases slowly as redshift increases beyond z ∼ 1.2 but now all the way to z ∼ 6. The value of b is about 40% larger for lower mass galaxies.
In the bottom panel of Fig. A.1, we show the redshift evolution of the zero-point offset (Δa) for galaxies with stellar masses M* > 2 × 10⁹ M⊙, alongside predictions from the Horizon-AGN (dashed green line) and TNG100 (dashed pink line) simulations for comparison. A clear increasing trend is observed in Δa for the lower-mass galaxy sample (blue line), particularly up to z ∼ 2.5 agreeing with Horizon-AGN results. However, there is weak decline in Δa beyond z > 2.5. This behaviour may reflect a transition in the dominant physical processes affecting galaxy structure at high redshift such as increased merger rates, evolving mass-to-light ratio, etc. Further investigation is needed to understand the physical mechanisms driving this trend.
All Tables
Fundamental plane coefficients for the massive spheroidal galaxy sub-sample (M* > 1 × 10¹¹ M⊙).
Fundamental plane coefficients for all spheroidal galaxies with M* > 2 × 10⁹ M⊙.
All Figures
|
Fig. 1. Comparison of VCF for the various cosmological hydrodynamical simulations highlighting the importance of larger simulation box size. It can be seen that the VCF is significantly underestimated at zero separation (velocity dispersion), galaxy scale (r ≈ 1 h−1 Mpc) and cluster scale (r ≈ 10 h−1 Mpc) when the simulation size is less than 1cGpc |
| In the text | |
|
Fig. 2. Distribution of 3D half stellar mass radius (log Rhsm), SDSS (g − r) colour, stellar age in r band (log ager), and Sérsic index (nSérsic) versus stellar mass (log M*) for selected spheroidal galaxies (blue points), their massive sub-sample ( |
| In the text | |
|
Fig. 3. Redshift evolution of SM-FP for the spheroidal galaxies in HR5. Note that galaxies are located along the diagonal line as the best-fit FP coefficients are used at each redshift. The relation moves to the right as galaxies grow in size with time. Left: For the massive sub-sample with M* > 1 × 10¹¹ M⊙Right: For the sample with M* > 2 × 10⁹ M⊙. To mitigate the overlap of points, black contours are plotted for the initial five redshifts, representing the central 90% of galaxies contained within. |
| In the text | |
|
Fig. 4. Redshift evolution of the SM-FP parameters: slope coefficients, b (top) and c (middle), and zero-point variation, Δa = az − azi (bottom). The results of the HR5 samples are indicated by a red curve for the massive sub-sample and a blue curve for the full sample. The errors on a, b, c, Δ, and Δ/Δr were estimated using bootstrap resampling for the massive sub-sample, while for the broader sample that includes lower-mass galaxies, they were determined with the sub-sampling method. Observational constraints from Hou & Wang (2016) and Bernardi et al. (2020) are shown as magenta and yellow points, respectively. |
| In the text | |
|
Fig. 5. Redshift evolution of SM-FP for the spheroidal galaxies in HR5. The symbols are coloured according to the mass-weighted average stellar age (upper panels), Vrot/σe (middle panels), and sSFR = SFR/M*[yr−1] (bottom panel). The 1:1 line is depicted in black in each panel. |
| In the text | |
|
Fig. 6. Comparison between the L-FP and the SM-FP as a function of redshift. The panels show the evolution of FP coefficients b (top) and c (middle), and the zero-point offset, Δa = az − azi (bottom). Results are shown for two stellar mass-selected samples: a massive sub-sample with M* > 1 × 10¹¹ M⊙ (red) and the full sample with M* > 2 × 10⁹ M⊙ (blue). Solid lines correspond to the SM-FP, while dashed lines indicate the L-FP. |
| In the text | |
|
Fig. A.1. Redshift evolution of the L-FP coefficients, b (top), c (middle), and the zero-point offset, Δa = az − azi (bottom), where the L-FP is defined as log Rhsm = a + blog σe + clog Ie. Results from this work are shown for two stellar mass-selected samples: a massive sub-sample with M* > 1 × 10¹¹ M⊙ (solid red line) and the full sample with M* > 2 × 10⁹ M⊙ (blue dash-dotted line). For comparison, we also show L-FP results from other cosmological simulations (HorizonAGN: dashed green line; TNG100: dashed magenta line) and observational studies (Jørgensen et al. 1996; van Dokkum & Franx 1996; Saglia et al. 2010; Hou & Wang 2015; Stockmann et al. 2021). |
| In the text | |
Current usage metrics show cumulative count of Article Views (full-text article views including HTML views, PDF and ePub downloads, according to the available data) and Abstracts Views on Vision4Press platform.
Data correspond to usage on the plateform after 2015. The current usage metrics is available 48-96 hours after online publication and is updated daily on week days.
Initial download of the metrics may take a while.