Fig. 4.
Download original image
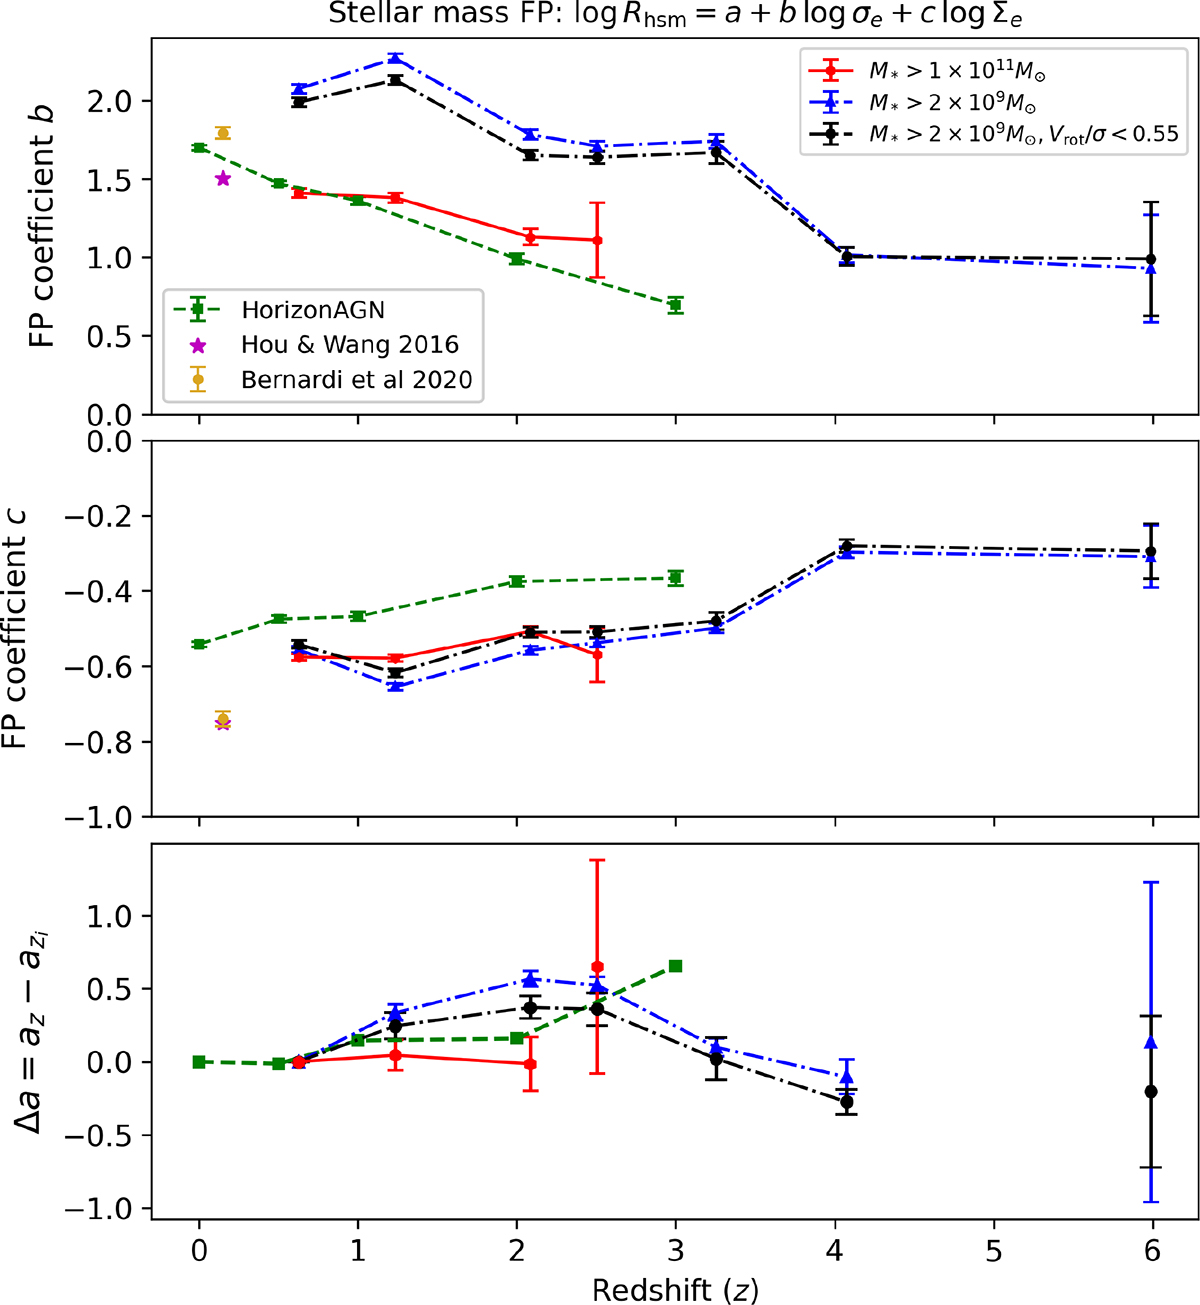
Redshift evolution of the SM-FP parameters: slope coefficients, b (top) and c (middle), and zero-point variation, Δa = az − azi (bottom). The results of the HR5 samples are indicated by a red curve for the massive sub-sample and a blue curve for the full sample. The errors on a, b, c, Δ, and Δ/Δr were estimated using bootstrap resampling for the massive sub-sample, while for the broader sample that includes lower-mass galaxies, they were determined with the sub-sampling method. Observational constraints from Hou & Wang (2016) and Bernardi et al. (2020) are shown as magenta and yellow points, respectively.
Current usage metrics show cumulative count of Article Views (full-text article views including HTML views, PDF and ePub downloads, according to the available data) and Abstracts Views on Vision4Press platform.
Data correspond to usage on the plateform after 2015. The current usage metrics is available 48-96 hours after online publication and is updated daily on week days.
Initial download of the metrics may take a while.