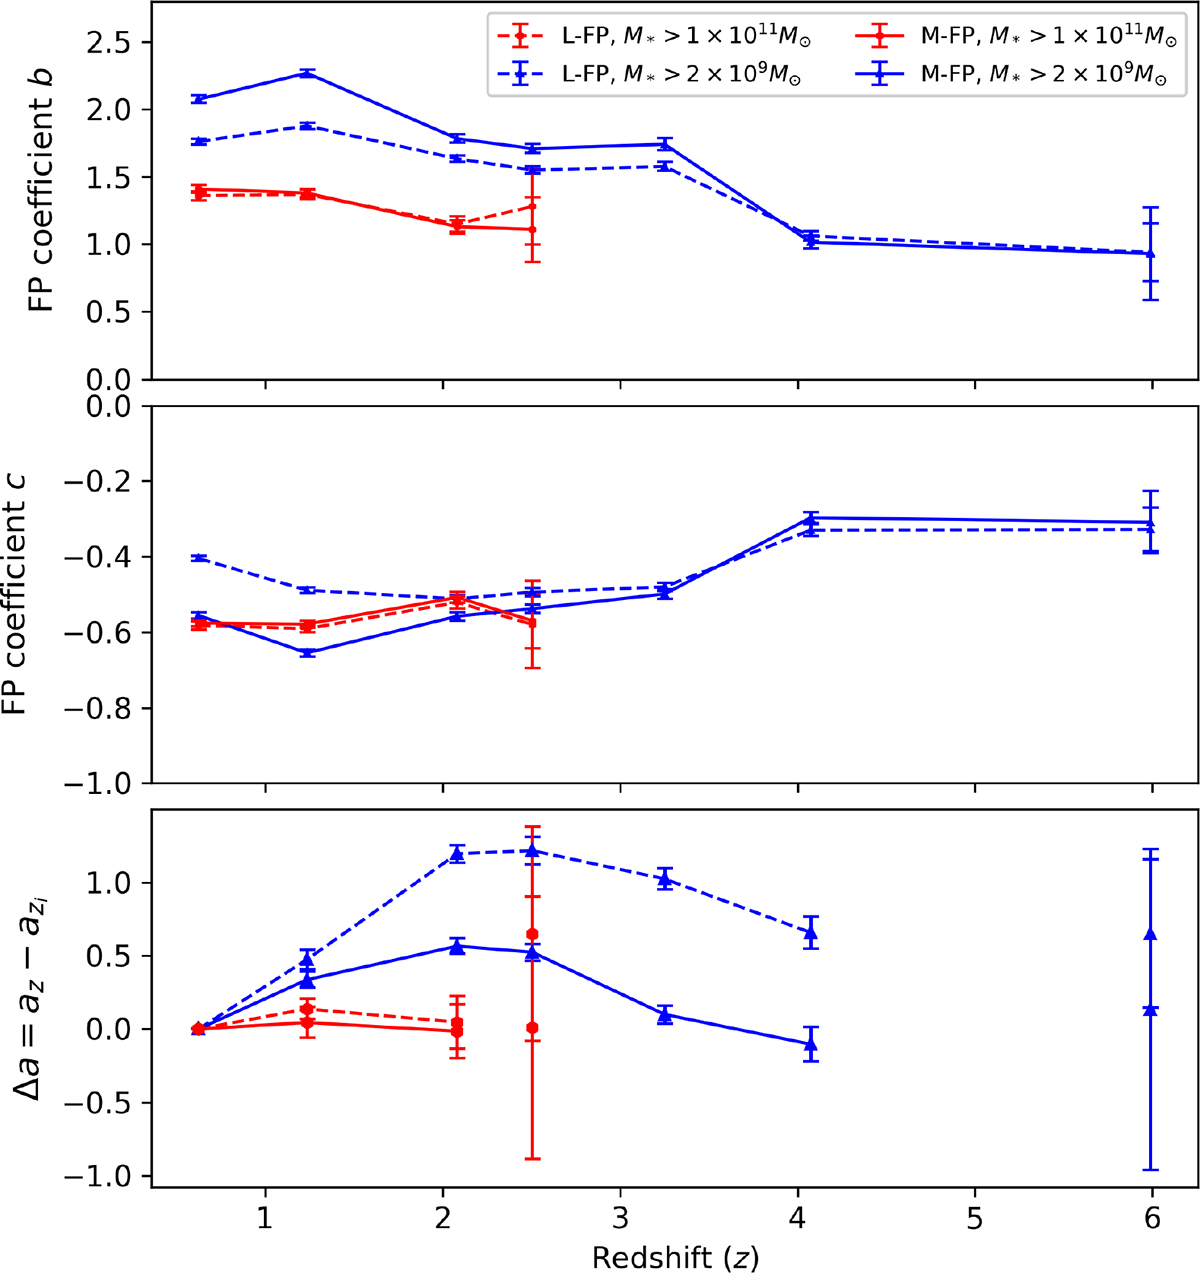
Fig. 6.
Download original image
Comparison between the L-FP and the SM-FP as a function of redshift. The panels show the evolution of FP coefficients b (top) and c (middle), and the zero-point offset, Δa = az − azi (bottom). Results are shown for two stellar mass-selected samples: a massive sub-sample with M* > 1 × 10¹¹ M⊙ (red) and the full sample with M* > 2 × 10⁹ M⊙ (blue). Solid lines correspond to the SM-FP, while dashed lines indicate the L-FP.
Current usage metrics show cumulative count of Article Views (full-text article views including HTML views, PDF and ePub downloads, according to the available data) and Abstracts Views on Vision4Press platform.
Data correspond to usage on the plateform after 2015. The current usage metrics is available 48-96 hours after online publication and is updated daily on week days.
Initial download of the metrics may take a while.